CHAPTER 9
Phyletic Evolution of Cryptopecten vesiculosus
|
The fossil records of Cryptopecten vesiculosus can be traced back to the Middle Pliocene (ca. 3.5 Ma), Though some dead-end incipient species may have arisen from this stock, many fossil samples seem to indicate the persistency and phyletic morphological change of this species. The geographic distribution of this pectinid, especially the northern and southern limits, must have fluctuated during the geologic past in accordance with changing marine conditions, but its center seems to have remained in the seas surrounding the Japanese Islands. So far as I am aware, there is no undoubted fossil occurrence of C. vesiculosus in countries other than Japan. More than 10 Pliocene, more than 20 Pleistocene and one Holocene fossil samples in addition to a number of Recent ones are available for the study of phyletic evolution of this species (see List of Examined Samples (pp. 127-137) for their localities, horizons, etc.), though some of them are not very useful owing to the small sample size and ambiguous geologic age. Many characters of these fossil samples, except for some Late Pleistocene and Holocene ones, are clearly outside the range of geographic variation in the present seas, and are mainly attributable to evolutionary change. At the same time it is here recognized that some characters changed directionally with time. 1.Shell Size and Growth Rate [see Table 13]
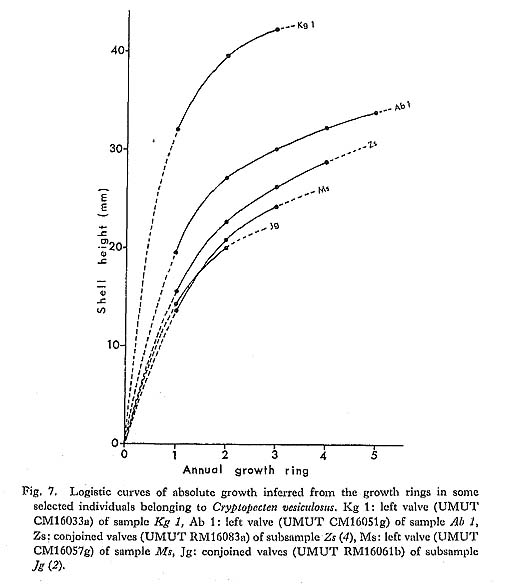
The overall shell height of the largest individual ( The phyletic size decrease is also clearly indicated by the different values of The Late Pliocene sample Kg 1 shows unusually larger values of 2. Shape of Shell [see Tables 4-10]
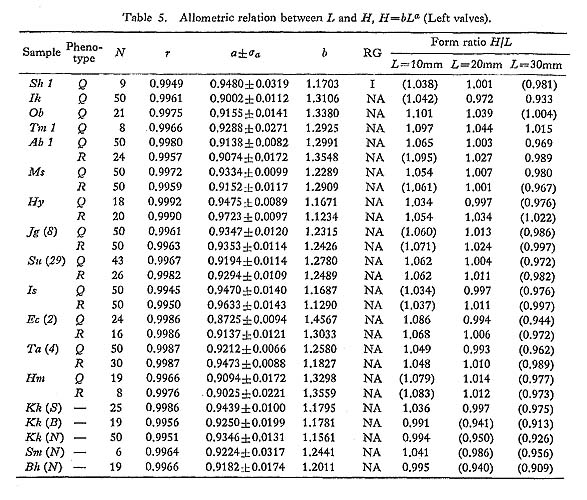
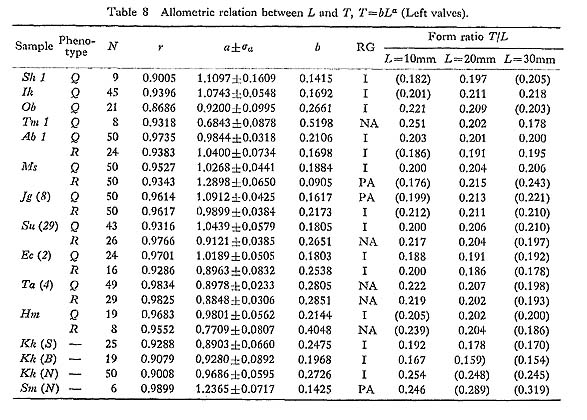
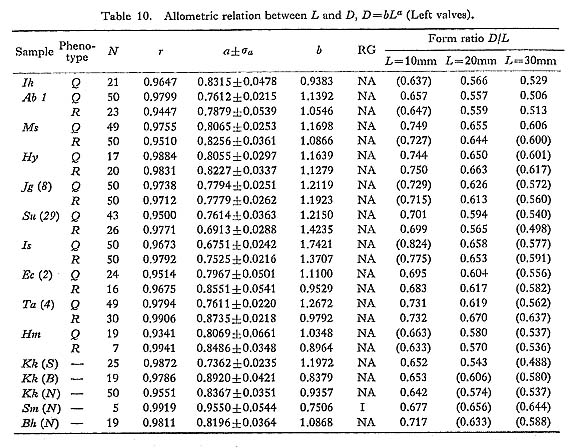
The allometric equations of average relative growth between L and H, L and T, and L and D, as well as standardized form ratios H/L, T/L and D/L, were obtained on several fossil samples. The values of growth ratio (a) are sometimes significantly different between samples of different ages, but there is nothing like a definite trend. The Pliocene sample Ik seems to show unusually smaller values of H/L (i. e., comparatively low outline) in every growth stage than other contemporary and younger samples (Plate 7, Figs. 9, 10). In contrast, the Middle Pleistocene sample Tm 1 (and also Tm 2) has decidedly larger values (i. e., comparatively tall outline) in comparison with other samples (Plate 7, Figs. 7, 8). These peculiar features are so conspicuous that one can perceive their uniqueness at a glance. However, no definite trend with time can be detected for this character and other form ratios.
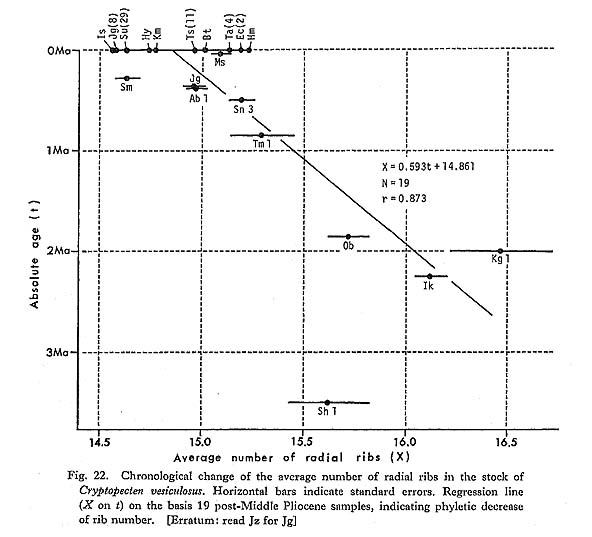
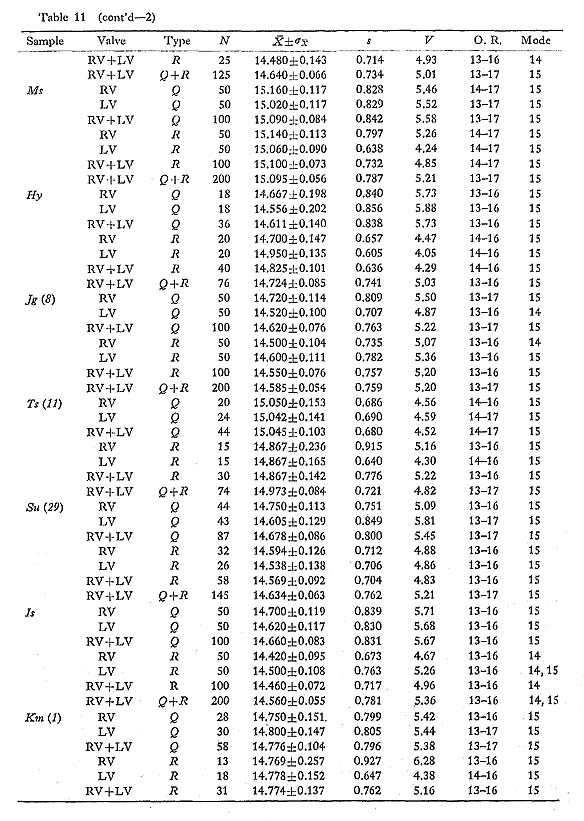
3. Number of Radial Ribs [see Table 11]
The number of radial ribs on the disk (X), particularly its average and variability, is an easily recognizable and probably meaningful character on which chronological change can be discussed. This character was examined on five large Pliocene and seven large Pleistocene samples. These fossil samples show similarly unimodal and nearly normal frequency distribution in the number of radial ribs and comparable coefficient of variation (V) with Recent samples. Taking the aforementioned data on Recent samples into consideration, it is concluded that the average number of radial ribs As illustrated in Fig. 22, the obtained values of
The geographic variation of The oldest sample of C. vesiculosus, Sh 1, shows a value of 4. Surface Sculpture (Phenotypic Frequency) [Table 12]
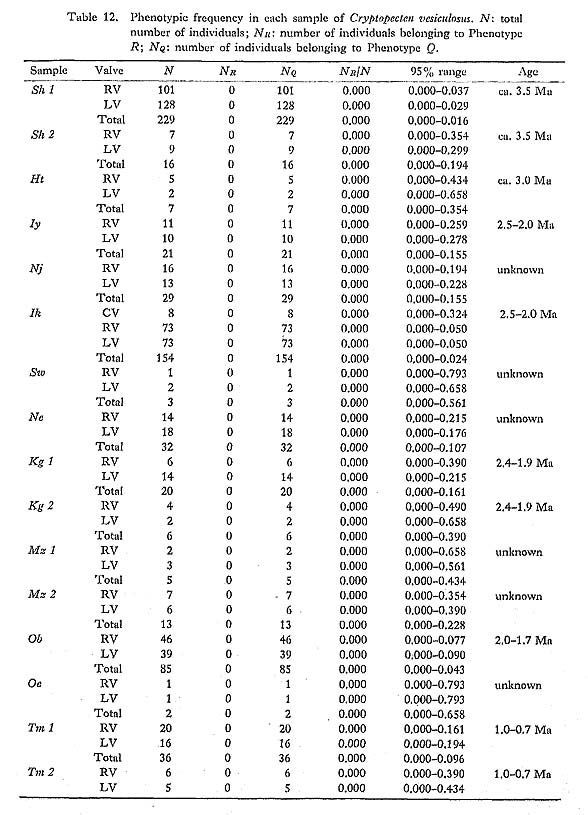
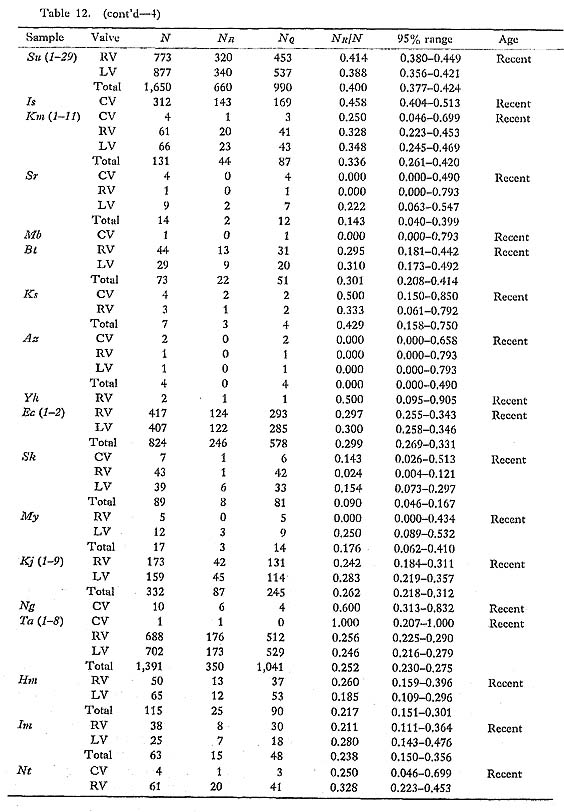
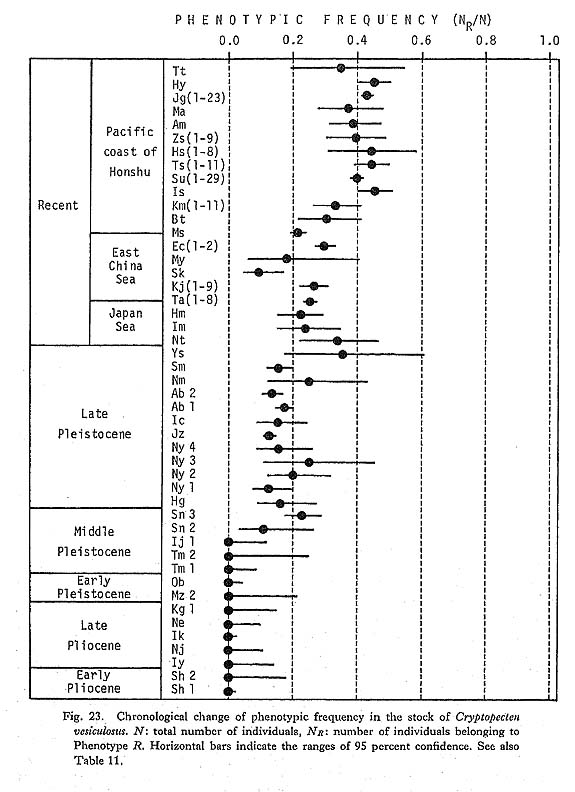
Discrimination between the two phenotypes Q and R is also possible in every fossil sample, even those in poorly preserved condition. Therefore, the phenotypic frequency NR/N is a clean-cut and useful character for the study of phyletic change at the population level. The historical change of this character was discussed in some detail in my previous paper (Hayami, 1973). My conclusion there about the gradual change of phenotypic frequency as well as the concept of phenotypic substitution as a cause of morphological break without any intermediate form (Hayami and Ozawa, 1975) is fundamentally supported by subsequently accumulated data. Many fossil samples of C. vesiculosus were examined, but no individual belonging to the Phenotype R could be found in Pliocene and Early Pleistocene samples. The Middle Pleistocene samples Ij 1 and Ij 2 are also entirely composed of individuals belonging to the Phenotype Q. The earliest occurrence of the Phenotype R so far known on the Pacific side is from the Middle Pleistocene Sanuki Formation (samples Sn 1, 2, 3, all approximately 0.5 Ma). Though the observed phenotypic frequency is somewhat variable among these Sanuld samples, the largest sample, Sn 3, shows a value of NR/N as high as 0.23. I have found a few individuals of the Phenotype R in a small sample (Dr. Ogasawara's private collection) from the Middle Pleistocene Shibikawa Formation of Oga Peninsula, signifying the nearly coeval appearance of this phenotype in populations on the Japan Sea side. In the Late Pleistocene, a temporal transgression with strong influence of warm current occurred, leaving prolific fossil beds of "Jizôdô fauna" in the middle part of the Boso Peninsula. The samples Ny 1, 2, 3, 4, Jz, and Ab 1, 2 are attributable to this horizon (approximately 0.37 Ma). These samples often show somewhat lower phenotypic frequency than the Middle Pleistocene Sanuki samples, but the value of NR/N is also considerably variable within the Jizôdô Formation. For example, the two large samples Ab 1 and Ab 2, which were randomly collected from two different layers about 2 meters apart of one and the same outcrop at Atebi, show significantly different phenotypic frequency; the sample Ab 1, taken from the lower layer, is richer in the Phenotype R than the sample Ab 2, taken from the upper layer. Within this brief period, therefore, minor fluctuation of phenotypic frequency may have occurred. The observed values of NR/N in the large samples of this horizon are, however, confined to the range from 0.12 to 0.20, and it is probably appropriate to roughly estimate the average phenotypic frequency at the Jizôdô transgression is at 0.15. The horizon of the sample Sm was actually determined by Sugihara et al. (1978), using marker tephras to be the upper part of the Yabu Formation (approximately 0.29 Ma). The value of NR/N of this sample is not much different from the average value of the Jizôdô samples. The geographic variation of the phenotypic frequency in Recent samples is, as stated before, considerably wide. However, large Recent samples from the Pacific coast of central Honshu seem to be fairly stable in this character; the observed frequency ranging from 0.39 to 0.46 is much higher in comparison with these Pleistocene fossil samples. The phenotypic frequency in the Recent samples from the East China Sea and Japan Sea is as low as from 0.17 to 0.30, but still seems to be higher than that of the Pleistocene ones. Because there is no large Middle or Late Pleistocene sample in the areas facing the East China Sea and Japan Sea, almost nothing has been known as to the geographic variation nf this character in the past. As shown in the collective illustration in Fig. 23, how ever, the chronological change of the phenotypic frequency may be said to have a trend, if not truly unidirectional.
The present conclusion is unexpectedly in harmony with the aforementioned phyletic decrease in the average number of radial ribs. This may not mean pleiotrophic effect of the same genetic factor, but it is not surprising to see that the phyletic change of the two independent characters, and probably also the related gene frequency, are the most advanced in the peripheral area of distribution (Pacific coast of central Honshu). The populations in the East China Sea and Japan Sea may be more conservative, the genetic nature having perhaps changed somewhat behind the Pacific side populations. In 1973, I estimated the values of selection coefficient (s) as well as those of the change of gene frequency per one generation (Δq) based on an assumption of the simplest relation between genotypes and phenotypes. The genetic background of this dimorphism is still unknown, but, on the same assumption, the estimated values of s and Δq should be revised, because recent geochronology reveals that the absolute age of the Jizôdô Formation was greatly underestimated in my 1973 article. Assuming the same time span of one generation (two years on average), the following revised values are obtained:
The result of the above calculations indicates for every case that a slight difference of adaptive value (only of the order of 10-5 on the average) between the individuals of the two phenotypes would explain the phyletic change of phenotypic frequency. Because their morphological difference is quite significant, I still maintain that natural selection is a probable cause for the observed phenotypic substitution. However, a slight difference of adaptability like this, if present, would not be practically testable with capture-release experiments in the field, because a sample composed of more than a million living individuals would be required for this test. At the same time I would by no means deny the possibility of non-adaptive causes for this evolutionary change. For example, this slow rate of substitution may also be explicable by spontaneous mutation pressure (only of the order of 10-6 per one generation). The effect of random genetic drift, which is most certainly dependent on population size, is also a possible cause, for it is questionable whether such weak selection pressure or mutation pressure could concur with this effect. Regrettably, it must be concluded that the cause of this phenotypic substitution is almost beyond resolution. The current debate between the selectionists and the neutralists would still remain unresolved, even if more ideal fossil records were investigated. Raup (1977), citing Hayami and Ozawa's (1975) data on the historical change of phenotypic frequency in the lineage of this pectinid (the same data as in my 1973 article), is of the opinion that our observed trend is not necessarily attributable to a deterministic cause like natural selection, because the null hypothesis of random walk cannot be rejected with 95 percent confidence. I agree with him that the trend may be caused by various nonadaptive factors, including stochastic ones. However, Feller's theorem, which was applied by Raup (1977) for the test of random walk, takes into account only the differential frequency of plus and minus signs in a time series of morphological change, and various other valid quantitative data such as net amount of change, number of contemporary samples, sample size, standard errors, and time span between samples are not utilized. I dare say, therefore, that the effectiveness of this test for this purpose is rather weak, and rpliable evaluation of random walt cannot necessarilybeachieved. |

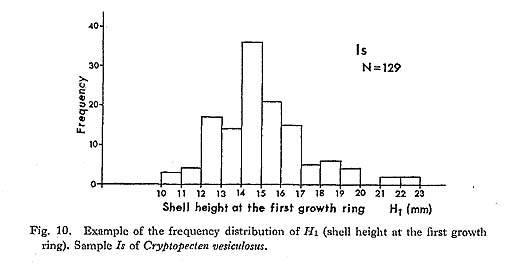
 ) and the average shell height at the formation of the first stepwise growth ring (
 ) for several selected large fossil and Recent samples were compared. The value of


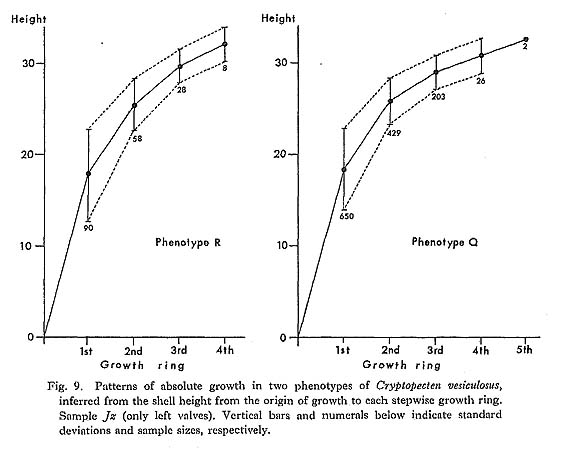


 has decreased considerably with time. The obtained values of
  in all the examined Pliocene samples (Sh 1, Nj, Ik, Kg 1 and Mz 2), which sometimes exceed 16.0, are evidently larger than those of the Pleistocene and later samples. The Early and Middle Pleistocene samples (Ob, Tm 1, Sn 3) seem to be intermediate in this character between Pliocene and Holocene-Recent ones. The values of