CHAPTER 7
Intrapopulational Variation and Relative Growth
|
As was fully discussed and enumerated by Mayr (1963, pp. 138-163; 1969, pp. 144-163), individual variation within a single interbreeding population may be caused by various genetic and nongenetic factors. Because environmentally induced morphological modification has almost nothing to do with evolutionary change, causal evaluation of variation, though not necessarily easy in fossil and marine molluscs, is of primary im-portance for evolutionary studies of this kind. Individual variation of morphological characters are classifiable, though only for con-venience, into two types: continuous and discontinuous. Various morphometric (including meristic) characters such as body size at a definite growth stage, form ratios between two linear measurements, angles, and number of serially arranged organs commonly vary continuously, and usually show histograms resembling normal frequency distribution. This continuously varied unit character is generally regarded as being controlled by a large number of genetic and environmental factors. Discontinuous variation, on the other hand, is thought to be controlled by a single or a few genetic or nongenetic factor(s), Both types of individual variation are seen in each large population of Cryptopecten. Since Cryptopecten bullatus, Cryptopecten nux and extinct species of this genus are represented by relatively small samples in the present collection, the detailed examination of intrapopulational variation is for the most part restricted to several large samples of C. vesiculosus. The size of some of the samples precluded measurement of all the specimens, so 50 right and 50 left (or 50 conjoined) valves were randomly selected. In Middle Pleistocene and later samples two discrete phenotypes are distinguishable by the sculpture of the disk, and they were treated separately. Computations for statistics were made on these reduced samples excluding some broken valves which were inadequate for measurement. Meristic variation was examined on these and several more samples. Phenotypic frequency of dimorphism however, was examined on the basis of all indi-viduals in every fossil and Recent sample.
|
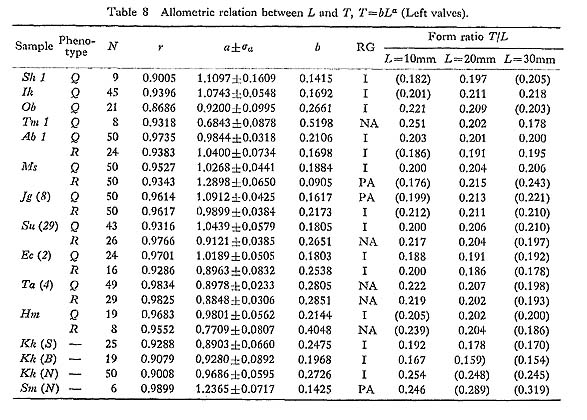
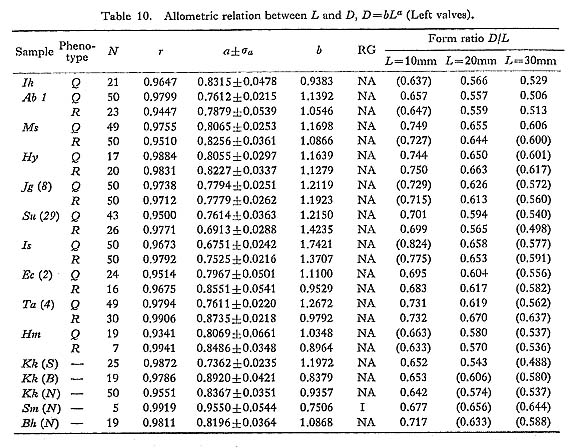
 : Standard error of growth ratio, which is obtained by
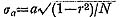


   |
The number of radial ribs on the disk is a univariate character currently applied for the identification and classification of pectinids. In every species of Cryptopecten, radial ribs are quite regular in prominence, neither bifurcated nor, except for very early dissoconch, inserted during the course of growth. Their number would therefore appear to be a growth-invariant character. As noted above (p. 22) however, in many individuals the outermost radial ribs near the anterodorsal and posterodorsal margins of disk are much weakened or have vanished altogether in the course of growth. I thus define X to be the number of radial ribs counted at the middle stage of growth (approximately 10 mm in height in C. vesiculosus, C. bullatus and C. yanagawaensis; approximately 7 mm in C. spinosus and C. nux).
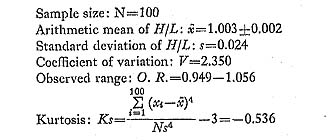
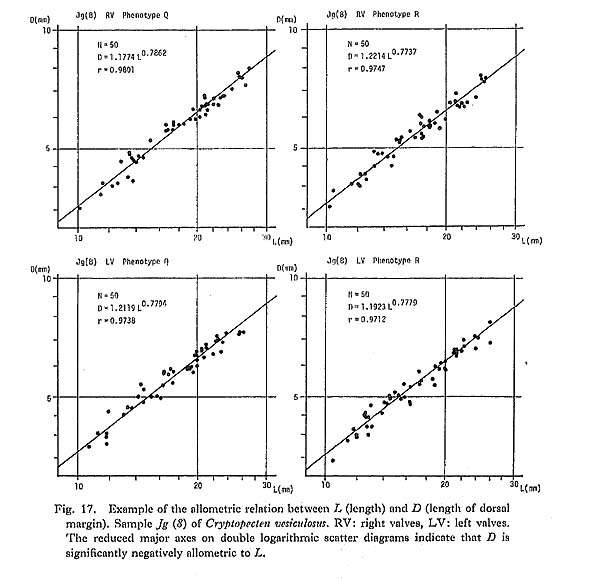
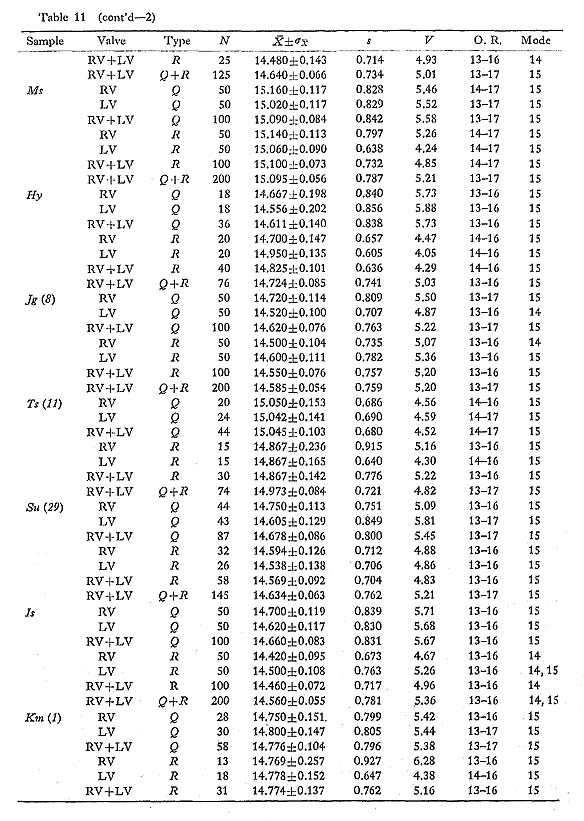
This character was examined on 135 lots of 22 samples of C. vesiculosus, three lots of one sample of C. spinosus, six lots of two samples of C. bullatus, six lots of two samples of C. nux, and three lots of one sample of C. yanagawaensis. The results are collectively given in Table 11, where the mean  , standard error
  , standard deviation (s), coefficient of variation (V), observed range (O. R) and mode of frequency distribution are indicated.
In C. vesiculosus the mode commonly lies at 14 or 15 in Recent and younger fossil samples, but at 16 in such older fossil samples such as Ik and Kg 1. The histograms arc almost always unimodal and resemble normal frequency distributions. The uniformity of variability of this character is worthy of notice; the standard deviation (s) is almost always confined to the range from 3.0 to 6.0. T-tests show that the values of  for each of the two valves in the same sample are seldom significantly different. The same is prob ably true for the two phenotypes, though in many cases Phenotype R seems to show a slightly smaller value of than Phenotype Q. This is probably because the radial ribs of Phenotype R are weaker and less conspicuous, especially near the peripheries of disk, than those of Phenotype Q.
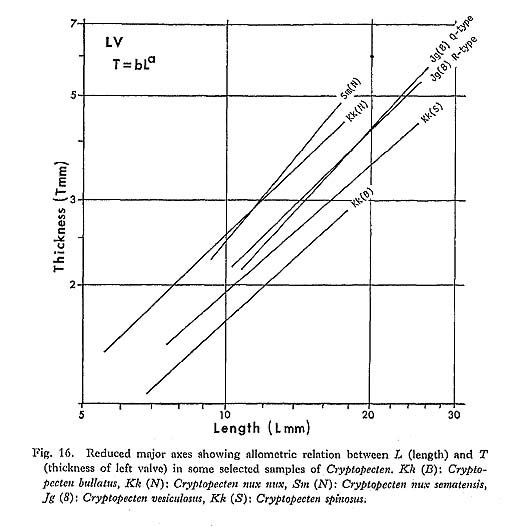
One of the distinguishing characters of C. spinosus is, as shown in the sample Kk (S), the significantly smaller number of radial ribs in comparison with the other species of Cryptopecten; the number ranges from 12 to 15, and the mode lies at 14.
C. bullatus has, meanwhile, more numerous radial ribs than C. vesiculosus. Though every Recent sample consists of a small number of individuals, the values of are ap proximately 20 in the samples USNM 764152 and Hs (B). This is not much different from the value of the Hawaiian and Philippine specimens including the holotype of C. alii. The fossil sample Kk (B), which is identical with C. bullatus in various other characters, nevertheless shows a somewhat larger number of radial ribs.
C. nux also possesses more numerous radial ribs than C. vesiculosus. Most specimens of the fossil samples Kk (N) and Sm (N) as well as several Recent and fossil specimens from various localities have 18 to 22 radial ribs.
C. yanagawaensis seems to have the most numerous radial ribs of the five species of Cryptopecten. In the solitary fossil sample Mn (Y) most specimens possess 20 to 25 radial ribs with the mode lying at 21 or 22. The variability of this character may not be so great as was suggested by Masuda (1958).
Although it is unknown whether this character is entirely controlled by genetic factors or not, I conclude that the number of radial ribs of Cryptopecten, is almost entirely growth- invariant and can be regarded as a useful univariate meristic character for discussions of geographic variation and evolutionary change as well as specific distinction.
B. Discontinuous Variation
Discontinuous variation is a phenomenon which is characterized by the presence of two or more discrete phenotypes within an interbreeding population. It may or may not be controlled by genetic factors. The term "polymorphism" is sometimes used for any kind of discontinuous variation, but, as was discussed by Mayr (1963, p. 150), such nongenetic discontinuous variations as age, social, ecological and traumatic variations are preferably distinguished from true polymorphism and treated under a different term, polyphenism. Ford (1940, 1964) denned genetic polymorphism as "the occurrence to gether in the same locality of two or more discontinuous forms of a species in such pro portion that the rarest of them cannot be maintained by recurrent mutation".
Most genetic approaches to evolution at the morphological level have been carried out on the basis of polymorphism, simply because the gene frequency of populations and its change in time and space can be easily recognized phenotypically. In marine organisms the genetic background of discontinuous variation is often difficult to determine. Still, discrimination between polymorphism and polyphenism is possible through careful observations of morphology, population structure and ecological habit as well as through analogy with well-experimented organisms.
1. Color Polymorphism
Polymorphism of shell coloration seems to be widespread in molluscs. In certain groups of the Bivalvia, ground color and color pattern vary discontinuously within one and the same population. Discontinuous variation of ground color is also quite striking in several species of Chlamys, Aequipecten, and some other genera of the Pectinidae. In the beautiful Japanese species, Chlamys (Mimachlamys) nobilis (Reeve), for example, most individuals are reddish brown in color, but orange, yellow, purple, and white individuals are occasionally found together in the same population. So far as I am aware, no Mendelian experiment has been successfully carried out, but the color variation of pectinids is probably genetic. In some land snails polymorphism in ground coloration and color banding is controlled by a series of multiple alleles constituting a supergene (Cain and Sheppard, 1950; Komai and Emura, 1955; etc.).
In the four extant species of Cryptopecten, most individuals are reddish-brown to magenta in ground color, frequently mottled with irregular oblique bands or spots of pale coloration. Certain individuals (less than 5 percent in C. vesiculosus) are yellow or orange in ground color. Though yellow and orange individuals are sometimes not clearly sepa rable from each other, they are never mottled but quite monotonic in coloration. The phenotypic frequency of yellow plus orange individuals can thus be clearly recognized in Recent samples, and it would be useful for the analysis of geographic variation if very large fresh samples could be examined. These features of color polymorphism are es sentially similar in C. vesiculosus, C. bullatus, C. nux and C. phrygium, suggesting that these species are closely related to one another and have a common ancestry.
Color polymorphism of Cryptopecten is an interesting phenomenon but generally difficult to observe in fossil samples. Mottled color pattern of Late Pleistocene fossil specimens are often visible (generally more clearly under ultraviolet light), but variation of ground color is hard to recognize.
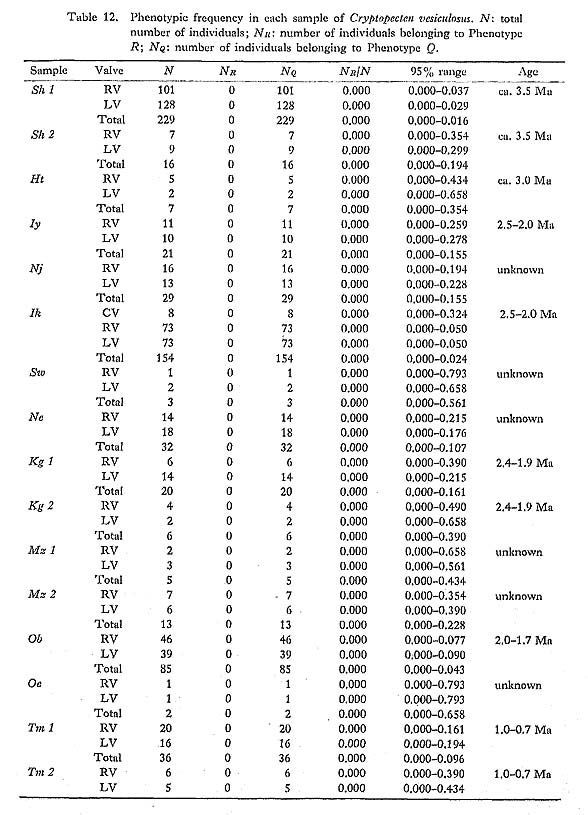
2. Dimorphism of Surface Sculpture in C. vesiculosus [Table 12]
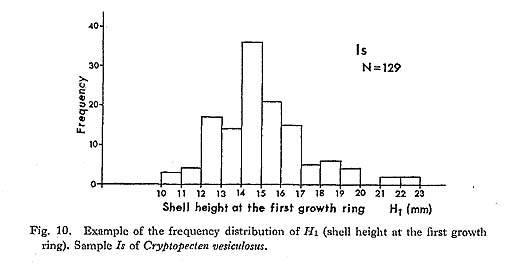
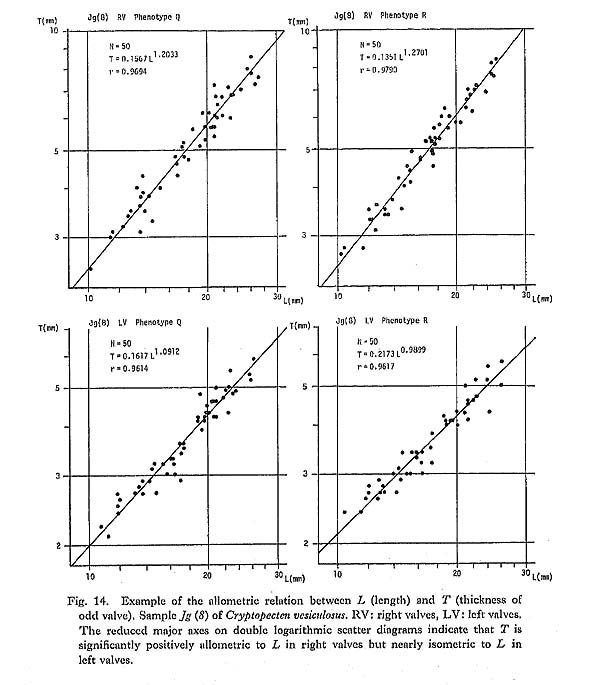
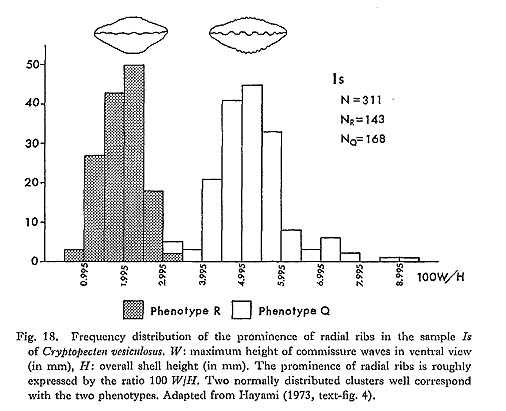
As pointed out previously (Hayami, 1972, 1973), every sample of C. vesiculosus after the Middle Pleistocene consists of two discrete phenotypes, called Q and R, without any intermediate individual. The morphological difference between these becomes clear after the beginning of the third stage of dissoconch. The fundamental radial rib structure, consisting of a central solid ridge and lateral hollow parts, is the same for the two phenotypes, but in transverse section the radial ribs of Phenotype Q are clearly more quadrate and highly elevated than those of Phenotype R. This difference is well reflected in the ratio between the overall height (H) and the maximum wave height of the com missure (W) in ventral view as studied previously on the samples Is and Jz (in part) (Hayami, 1973, figs. 4 and 5: here reproduced in Figs. 18 and 19). Clearly bimodal histograms of the ratio W/H were obtained and the two clusters correspond well with the two phenotypes.

A more conspicuous difference between the two phenotypes exists in the sculpture on the interspaces of radial ribs, especially in the inclination of scales and the shape of hollow parts, as will be described in detail in the systematic description (p. 23). The scales covering the hollow parts in both phenotypes are frequently exfoliated in abraded dead shells and fossils. Nevertheless, the distinction between the two phenotypes is always quite clear and never arbitrary. Therefore the phenotypic frequency can be pre cisely determined in every sample. The results are collectively shown in Table 12.
   |
The individuals belonging to Phenotype Q seem to be further separable into two sub phenotypes by the presence or absence of erect scales on the top of the central ridges (see Plate 4, Figs. 1, 2, Plate 5, Figs. 1, 2). The two subphenotypes, called rough type and smooth type, are discontinuous with few intermediate individuals. For example, among 169 individuals belonging to Phenotype Q of the sample Is, 60 and 109 individuals are assigned to the rough type and smooth type, respectively. The frequency of the two sub phenotypes is also recognizable, though somewhat arbitrarily, in some well-preserved dead shell and fossil samples (Plate 6, Figs. 1, 2), but their discrimination is generally difficult in the case of abraded specimens and individuals smaller than 10 mm in length. The top of radial ribs in Phenotype R is, on the contrary, always quite smooth, lacking any erect scales. This fact may suggest that the discontinuous variation between the two subphenotypes is controlled by some cause related to the factor determining the pheno typic difference. Although the smooth subphenotype appears at a glance to be morpholog ically intermediate between the rough subphenotype and Phenotype R, the hypothesis of Hardy-Weinberg equilibrium, that the first were heterozygote individuals between two homozygote ones, is statistically rejected in Is and some other large samples.


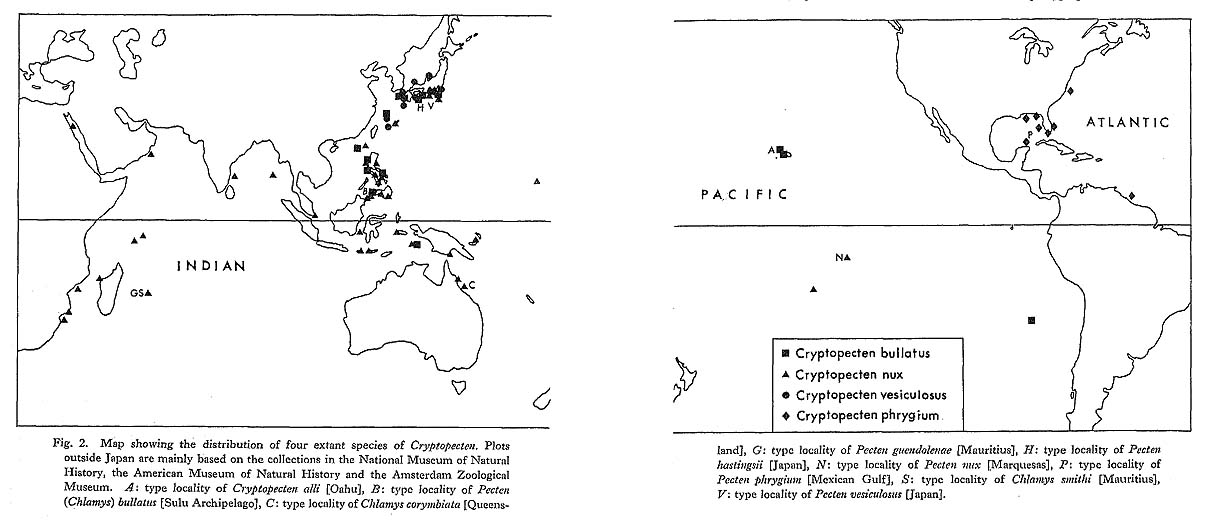 Fig. 2. Map showing the distribution of four extant species of Cryptopecten. Plots outside Japan are mainly based on the collections in the National Museum of Natural History, the American Museum of Natural History and the Amsterdam Zoological Museum. A: type locality of Cryptopecten alli [Oahu], B: type locality of Pecten (Chlamys) bullatus [Sulu Archipelago], C: type locality of Chlamys corymbiata [Queens-land], G: type locality of Pecten guendolenae [Mauritius], H: type locality of Pecten hastingsii [Japan], N: type locality of Pecten nux [Marquesas], P: type locality of Pecten phrygium [Mexican Gulf], S: type locality of Chlamys smithi [Mauritius], V: type locality of Pecten vesiculosus [Japan]. |
Judging from the following facts, these phenotypes are taxonomically inseparable in spite of the clear morphological discontinuity.
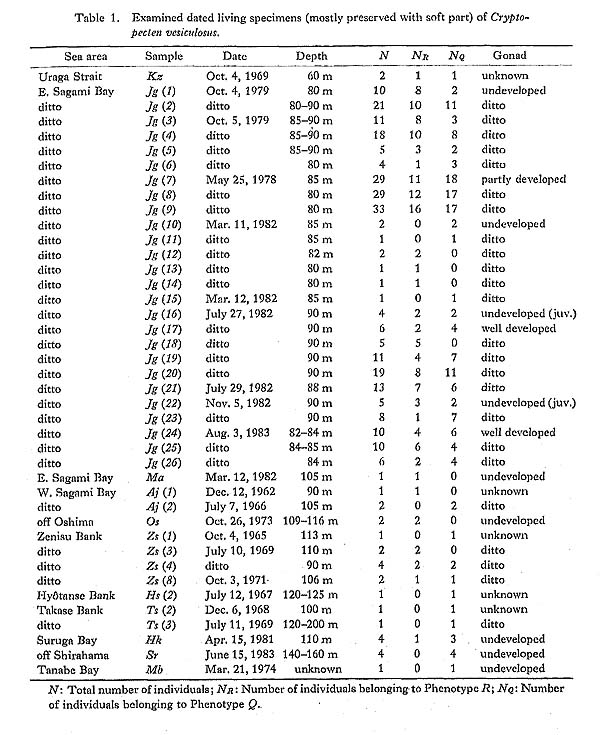
1) Living individuals belonging to the two phenotypes were always found together within the same dredge sample (or subsample) (e. g., Kz, Jg (1-9, 16-23), Zs (4, 8), Hk) (Table 1).
2) The two phenotypes are coexistent in all the large samples of Recent dead shells as well as fossils after Middle Pleistocene. The phenotypic frequency is considerably stable in the same sea area, though some geographic variation and chronological change are known, as discussed later. Perfect distribution overlap of this sort is quite unlikely in the case of sibling species.
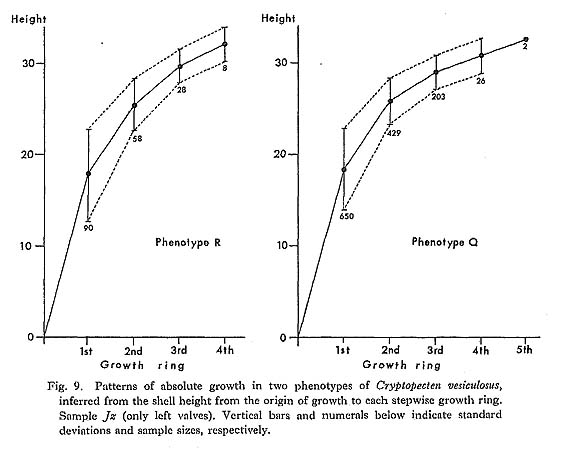
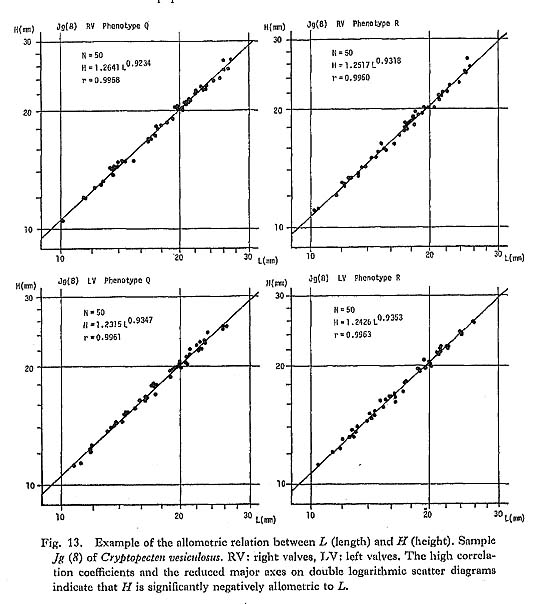
3) The two phenotypes are clearly distinguishable by their different sculpture, but no significant difference can be observed as to their coloration, size, growth rate presumed from the intervals of growth rings, average number of radial ribs, various bivariate characters of shell, and anatomical characters of soft parts. This dimorphic phenomenon is therefore quite independent of the variation of other characters.
4) As a result of my examination of living populations in Sagami Bay, it was found that the breeding season is not different for the two phenotypes. The reproductive glands are fully developed in all the large specimens of both phenotypes, which were collected near the end of July (subsamples Jg (16-21)) and the beginning of August (subsamples Jg (24-26)).
Though nobody has successfully observed any living population of C. vesiculosus in its habitat, the ecological habits of the two phenotypes seem to be the same, judging from my own observation on freshly dredged specimens and their behavior in aquaria. As already described, this pectinid is certainly hermaphroditic, and this discontinuous variation is never attributable to sexual dimorphism.
Such discontinuous variation of sculpture is unknown in other species of Cryptopecten. All the available samples of C. bullatus, C. nux, C. phrygium, C. spinosus and C. yanagawa ensis, as well as those of C. vesiculosus predating the Middle Pleistocene, are monomorphic in this character, always exhibiting erect (not imbricated) scales on the interspaces of radial ribs like the Phenotype Q of C. vesiculosus. In this respect Phenotype R seems to represent a more specialized and probably more advanced morphology than Phenotype Q, and I regard here the former as mutant and the latter as wild-type.
Somewhat similar dimorphic phenomena can be observed in some other pectinids. As will be shown later, the populations of Aequipecten commutatus (Monterosato, 1875) from the Mediterranean seem to consist of two discrete phenotypes, the radial ribs of which may or may not have a hollow structure. In Aequipecten opercularis the surface of radial ribs and interspaces is either rough or smooth as with the two sub phenotypes in Q-type individuals of C. vesiculosus.
The relation between Volachlamys hirasei (Bavay, 1904) and Volachlamys awajiensis (Pilsbry, 1905) is another striking case which I have observed. The surface sculpture of the two nominal species appears to be quite different; the radial ribs are rounded and much weakened in V. hirasei, whereas they are subquadrate and highly elevated in V. awajiensis. For a long time many Japanese malacologists have regarded the two phena as specifically or subspecifically distinct, but the latter was sometimes regarded as a variety or a forma of the former (Kuroda, 1932; Habe, 1951). Though individual varia tion has been little studied at the population level, the two phena are distributed in the same sea areas (at least in the Inland Sea between Honshu and Shikoku, and Ariake Bay of Kyushu), and are hardly distinguishable by such characters as shell size, coloration, general outline and number of radials. As a result of my preliminary survey on the collec tion of the National Science Museum [Tokyo], it was found that the sample NSMT 46502 labelled V. hirasei awajiensis and the sample NSMT 46503 labelled V. hirasei hirasei came from one and the same locality (Okinohata Harbor of Yanagawa City, Kyushu). Although there are a few intermediate individuals, they are basically discontin uous. Nevertheless the two samples probably came from one and the same local popula tion. According to Dr. S. Okamura's personal communication (May 15, 1982), the two phena are also distinct but strictly sympatric at several stations in Osaka Bay. At present I am strongly inclined to regard the relation of the two phena as an example of intra populational discontinuous variation which is somewhat analogous to the case of C. vesiculosus. If this is true, V. awajiensis should be taxonomically treated as a junior synonym of V. hirasei, merely representing a sharply ribbed phenotype within one and the same species.
C. Evaluation of Ecophenotypic Effect
Of various types of ecological variation enumerated by Mayr (1969, pp. 152-155), habitat variation (or ecophenotypic effect) must be critically examined in studies of morphological variability. This effect may be defined as a purely nongenetic modification (or adjustment) of morphology in response to specific ecological conditions.
Among the various bivalves, ecophonotypic variation including xenomorphism (Stenzel, 1971, pp. N1021-1023) is predominantly known in the Ostreidae and some other groups whose shells tightly attach to hard substrates. Such ecological variation, though with less conspicuous effect, may also exist in byssate and free-living species. According to Beu (1966), for example, there are two ecophenotypes in Chlamys dieffenbachi (Reeve) from the southwestern Pacific; one is encrusted by sponge and the other is free-living. In this pectinid the number of radial ribs increases with growth, the increase occurring ontogenetically earlier and the shell growing much larger in the sponge-encrusted indi viduals than in the free-living ones. Consequently, it may be said that the number of radials varies ecophenotypically. Johnson (1981) interpreted the wide intrapopulational variation and ontogenetical flexibility of this character in the Jurassic species, Radulopecten vagans (Sowerby), as due to some ecophenotypic effect on the basis of analogy with the case of C. dieffenbachi, predicting that ecophenotypically varying organisms may be generally characterized by an ontogenetic reduction in variation.
So far as the number and mode of radial ribs of Cryptofecten are concerned, however, an ecophenotypic effect of this sort is unlikely in view of the following facts:
1) The radial ribs in every species of Cryptopecten are quite persistent except for the outermost ones, and their number never increases with growth. The variation is not flexible and seems to be inherently determined.
2) In each sample the frequency distribution of rib number is unimodal, resembling a normal curve.
3) Judging from the dredged living shells of C. vesiculosus in Sagami Bay, there is no evidence for ecological seqregation of the two phenotypes; their mode of life as well as attached organisms seem to be quite the same.
4) The phenotypic frequency is almost stable in the same sea area.
For the same reasons, I believe that other non-genetic causes (e. g., climatic, host determined, density-dependent and traumatic) are improbable for the sculpture di morphism of C. vesiculosus.