CHAPTER 9
Thermoluminescence of Barite Nodules from the Middle Paleolithic Hearth at Douara Cave
Kiyotaka Ninagawa, Isao Yamamoto, Nobusuke Takahashi, Naoki Inoue, Yoshihiko Yamashita, Tomonori Wada, and Hideo Sakai
9. 1 INTRODUCTIONSeveral barite nodules were found from a hearth deposit at Douara Cave (see Chapter 3 in this volume) and others were taken from a paleogene marl near the cave (see Plate 1.8:1 in this volume). The nodules excavated from the hearth deposit at Douara Cave had been baked. The fission track age of one of these burnt barite nodules, which had been excavated at Douara Cave by the fourth Tokyo University Expedition to Western Asia in 1974, was determined to be 75,000 BP (Nishimura, 1979). In the present work we have studied the thermoluminescence [TL] of a burnt barite nodule excavated at Douara Cave in 1984 and a barite nodule derived from a Paleogene marl, and have inferred their thermoluminescence ages. Hereafter, these two samples will be called "a burnt barite nodule" and "a barite nodule".
The thermoluminescence [TL] technique has been most commonly applied for the dating of pottery, earthen vessels and hearths in archaeology (Fleming, 1979; Ichikawa, 1981; Aitken, 1985). TL dating is based on measuring the total dose (absorbed dose) that the sample has received from natural radiation. The mechanism of TL is described elsewhere in literature (e.g., Curie, 1960; Aitken, 1985). Age is estimated from the following equation,
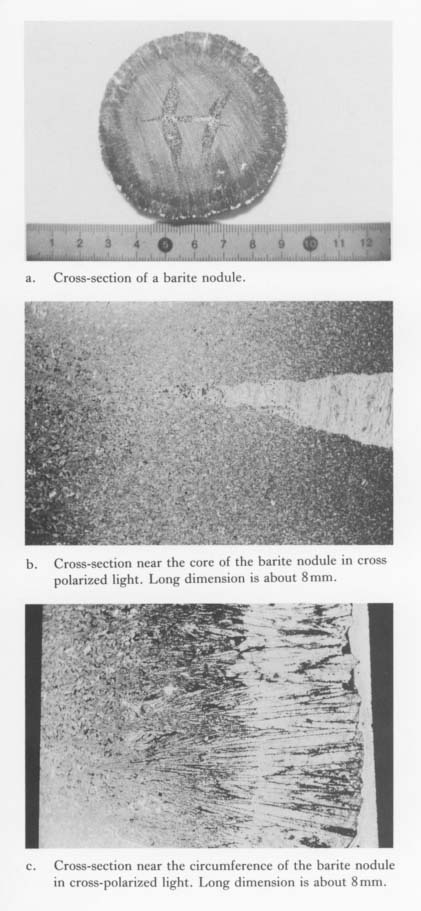
The annual dose is the absorbed doae received from natural radiation by the sample forone year. Annual dose can be evaluated from a radioactive and chemical analysis of the U, Th, and K2O contents of the sample and the surrounding soil. It can also be measured by TL dosimeters (for example, CaSO4: Tm or BaSO4: Eu) which are inserted into the sample and/or buried in the soil (Ichikawa, 1981). Quartz is the mineral usually used in TL dating. Barite has never been used for TL dating to the author's knowledge. In this study, therefore, the fundamental TL properties of barite, for example, the spatial distribution of TL and TL emission spectra had to be investigated first. 9. 2 SAMPLE PREPARATION AND EXPERIMENTAL APPARATUSTo measure TL spatial distribution, a diamond saw cut a slice from the barite nodule taken from the marl. Plate 1 is a cross section of a barite nodule from the marl. This nodule has a star-like cleft and three rings on the outside. The burnt barite nodule has a similar structure. To measure TL emission spectra and total dose, these samples were, at first, etched in 36N sulphuric acid to remove the surface portion, which was exposed to α-ray irradiation in the soil. Next, samples were gently ground with a mortar and pestle, and sieved to separate the fraction of 105-297 µm grain size. Separated grains were again etched by 36N sulphuric acid to remove surface distortion. Half of each grain sample was divided into eleven aliquots and irradiated with additive &Upsilom;-rays from 60Co. To measure the second glow, the remaining half was annealed at 550°C for 30 min. in N2 and irradiated with &Upsilom;-rays from 60Co. The system to measure the spatial distribution and TL emission spectra combines a low noise image intensifier [Hamamatsu Photonics Co. C2166] and a video image processor [ADS Co. IP-4]. To measure TL emission spectra the objective camera lens was replaced by a spectroscope. Details of this system have been reported elsewhere (Imaeda, 1985). To measure the total dose a photomultiplier with a bialkali cathode [Hamamatsu Photonics Co. R878] was used in an ordinary photon counting system. The samples were always heated in N2 with the temperature rising at a rate of 1.7°C/ sec. A color filter [Corning 4-96] was used, except in the case of TL emission spectra measurement, in order to cut incandescent radiation at high temperature. 9. 3 RESULTS AND DISCUSSION9. 3. 1 Spatial distribution of natural TL of the barite noduleThe spatial distribution of natural TL for the slice of the barite nodule in Plate 9. 1: a is illustrated in Fig. 9. 1. The position of high TL intensity is shown by the deep black points. In Fig. 9. 1, the TL image reflects structure of the barite nodule. The star-like cleft portion and the outer rings were brilliant. A photomicrograph of a point of the star is shown in Plate 9. 1: b. The transparent and large crystallized portions in Plate 9. 1: b, c were the most brilliant as shown in Fig. 9. 1.
9. 3. 2 TL emission spectraThe powdered sample of the barite nodule irradiated with additive 60 kR Upsilon;-rays from 60Co was used to measure TL emission spectra, with results shown in Fig. 9, 2. The region of high TL intensity is shown by deep black points. The emission spectrum at low temperature (100°C-200°C) had a broad emission with a 400 nm peak and at middle temperature (200°C-300°C) had a broad emission with a 500 nm peak. The spectra at high temperature (near 400°C) were similar to those at middle temperature. These spectra differed from those of BaSO4: Eu made in the laboratory (Yamashita, 1985). The incandescence radiation is also shown at its highest temperature (near 500°C).
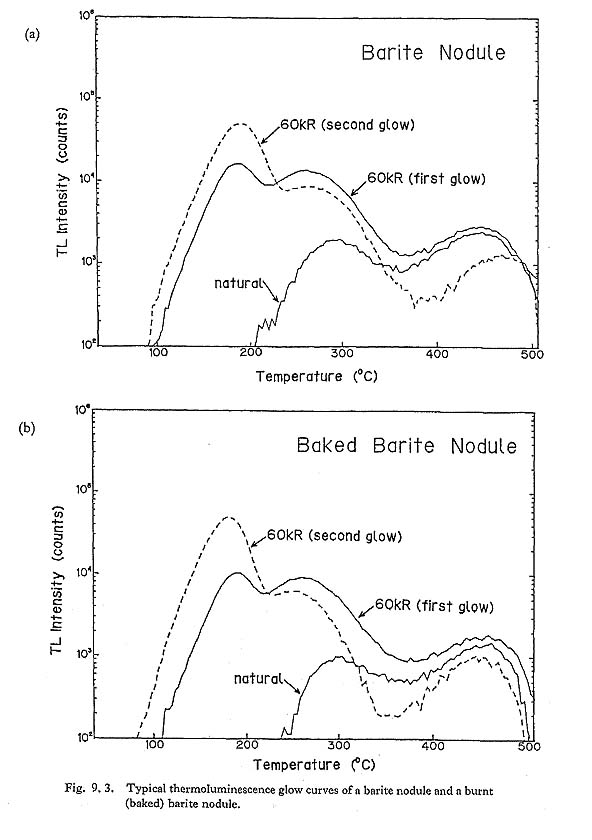
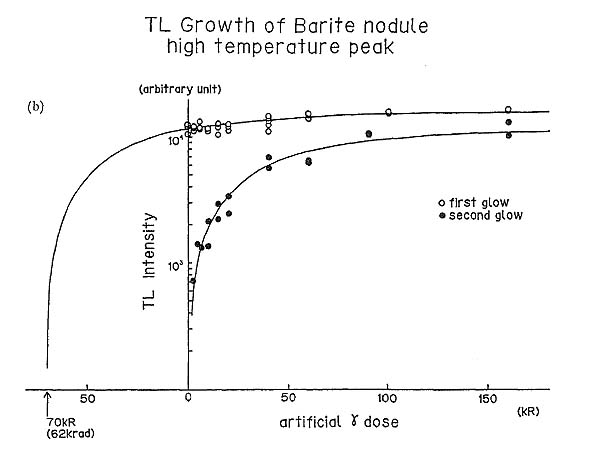
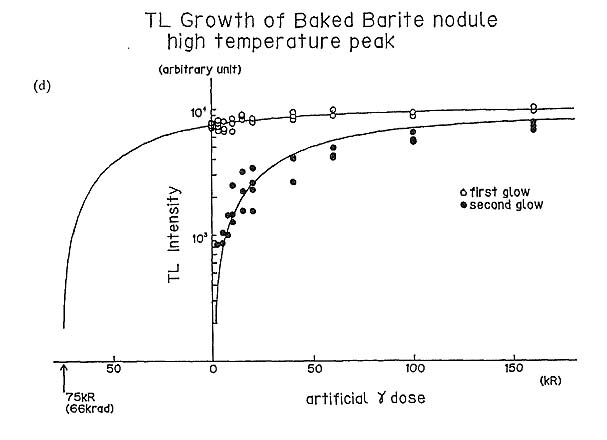
It is interesting that the emission spectrum at low temperature was different from that at the other temperatures. As can be seen in Fig. 9. 2, the Corning 4-96 filter is suitable for measuring the TL of barite, since the filter passes most of the light due to TL and cuts off the incandescent radiation. 9. 3. 3 Glow curve and total doseGlow curves of the samples are shown in Fig. 9. 3: a and 9. 3: b. These samples have three peaks at low, middle and high temperatures. The glow peak at low temperature for unburnt samples has faded away in the natural environmental temperature. For these samples, peaks at middle and high temperatures could be used for total dose measurements. The high temperature peak hardly increased with additive Upsilon;-ray irradiation in the first glow measurements. The second glow, which was induced from artificial 60Co Upsilon;-ray irradiation after annealing, is also shown in Fig. 9. 3. The growth of each second glow was used for calibration. TL intensity at both middle and high temperature peaks increased linearly at low dose and was saturated at high dose. Then the growth function of second glow peaks was suuoosed to be Y=N[1-exp(-aX)] (2) where X was an artificial dose. The parameter 'a' was determined to be 7.2×10⁻³/kR for the peak at middle temperature and 1.8×10⁻²/kR for the peak at high temperature by the least square method. The corresponding curves are drawn in Fig. 9.4. The growth function of first glow peaks was also supposed to be Y=N' [1-exp (-a(D+X))] (3) where D was the total dose we wanted to evaluate for both nodules, The value of the parameter 'a' was the same one used in eq. (2). These curves were well fitted to appropriate measurements.
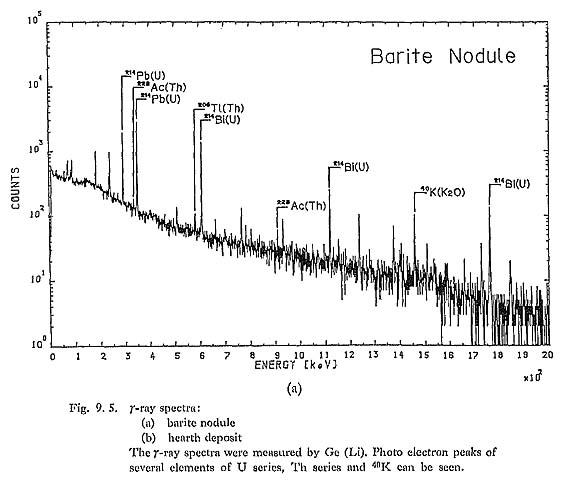
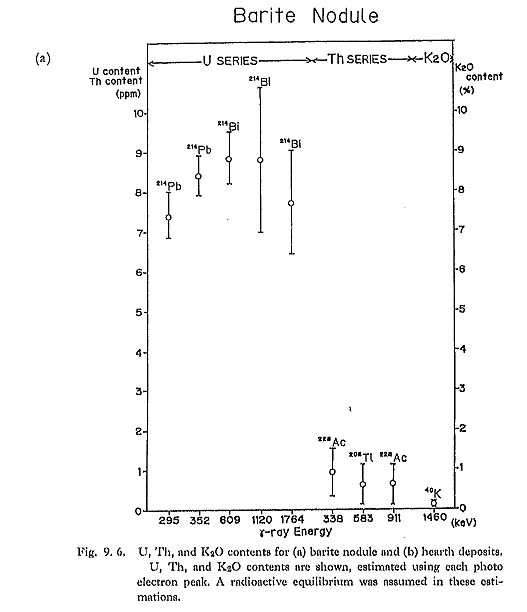
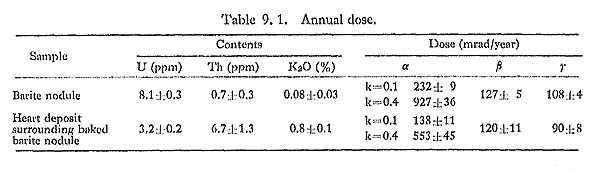
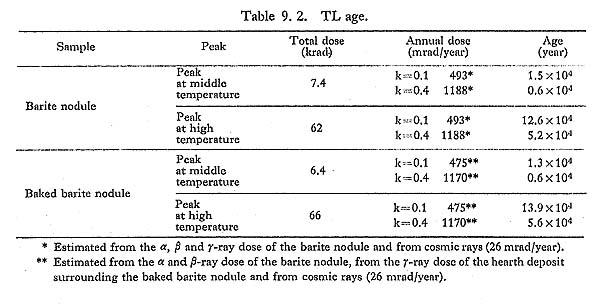
Using the peak at middle temperature, total doses (D) were set at 7.4 krad for the barite nodule and 6.4 krad for the burnt barite nodule. When the high temperature peak was used, they were 62 krad and 66 krad, respectively. For the total doses there was no essential distinction between the burnt sample and the unburnt one. The ratio of about 10, the total dose from the high temperature peak divided by that from the middle one, will be discussed below. 9. 3. 4 U, Th, and K2O contents and annual dosesTo estimate annual dose, U, Th, and K2O contents were determined by Ge(Li) Upsilon-ray spectroscopy for the barite nodule from Palaeogene marl and for the hearth deposit at Douara Cave. No determination was made for the burnt barite or for the marl surrounding the barite. The Upsilon-ray spectra of the barite nodule and the hearth deposit are shown in Fig. 9. 5. Many photo electron peaks of U series, Th series, and 40K were recorded. We used JG-1 for the standard sample. U-, Th-, and K2O-contents of JG-1 had been established (Ando et al., 1974). The content of each peak was estimated and shown in Fig. 9. 6. In this estimation radioactive equilibrium was assumed. Average U, Th, and K2O contents are listed in Table 9. 1.
Doses forα, β, and γ rays were estimated according to Bell's (1979) table. In this estimation the relative α-ray efficiency 'k' was supposed to be 0.1 or 0.4. The annual dose for the barite nodule was estimated to be 493 mrad/year for k=0.1, and 1,185 mrad/year for k=0.4. In the estimation, α and β rays doses from the barite itself were taken into account and the Upsilon-ray dose from the marl was replaced by that from the barite nodule.
The annual dose for the burnt barite nodule was estimated at 475 mrad/year for k=0.1, and 1,170 mrad/year for k=0.4. In the estimation, αand β ray doses from the unburnt barite nodule and the γ-ray dose from the hearth deposit were taken into account. The cosmic ray contribution was supposed to be 26 mrad/year for these calculations. 9. 3. 5 Age estimationThe ages were estimated using eq. (1) and are listed in Table 9. 2 (for the barite nodule and the burnt barite nodule). Consequently, the same value of age was given for each nodule.
There are three factors to be considered: concretion age of the barite nodule from the Paleogene marl, heating temperature of the burnt barite, and its age after being heated in the hearth. First we will consider the concretion age. Using the peak at the high temperature, TL age when the barite nodule concreted from the Paleogene marl was found to be 5.2-12.6× 10⁴ years. This age appears to be too young from a geological point of view (oral communication from Sakaguchi, 1986). This implies that the relevant traps, which bring the natural TL peaks at high temperature, are in thermal equilibrium; that is, the rate of trap filling due to the annual dose is equal to the rate of thermal fading. There may be a similar situation for the traps which give the peak at middle temperature. The hypothesis of thermal equilibrium, "the ratio of about 10 to 1", may be reasonable. Thus, the TL method would give the minimum concretion age of the barite noduel. The heating temperature of the burnt barite nodule in the hearth was presumed to be below 400°C from magnetic mineral investigation (Chapter 8 in this volume). For the burnt barite nodule, therefore, the TL peak at high temperature would give not the age after heating but the concretion age. The age found for concretion would also be the minimum one. The age 0.6-1.3×10⁴ years obtained from the TL peak at the middle temperature peak would be the minimum age after heating, providing that the heating temperature was above 350°C. The present minimum age is consistent with the age estimate of 75,000 years obtained by the fission track method (Nishimura, 1979). If the heating temperature was below 250°C, TL measurements could not be used for determination of the age after burning. AknowledgmentThe authors thank Professor Hasegawa, Kyoto University, for helpful suggestions. We are also grateful to Dr. Yamakoshi, Institute for Cosmic Ray Research, University of Tokyo, for Ge(Li) Upsilon-ray spectroscopy. LITERATURE CITED
|

 (1)
(1)