CHAPTER 8
Paleomagnetic Study of the Middle Paleolithic Hearth at Douara Cave
Hideo Sakai
8. 1 INTRODUCTIONBaked earths in archaeological sites are suitable for magnetic studies, since thermoremanent magnetization (TRM) in a sample can be correlated with the earth's magnetic field in the past. Paleomagnetism of materials over 50,000 years ago has been little studied, except the study of Barbetti and Flude (1979) with a hearth of the Boissejour in France, which was dated by thermoluminescence at about 50,000 BP. This chapter is concerned with a paleomagnetic study using samples of baked earth and barite nodules systematically collected from the Middle Paleolithic hearth at Douara Cave (34°38.5'N, 38°27.5'E). The purpose of the study is two-fold. Thermomagnetic analysis was applied to the barite nodule to examine the effect of heating and the synthesis of the sample, Measurement of the remancnt magnetization using the baked earth samples gave new data on geomagnetic direction and intensity at the site. 8. 2 THERMOMAGNETIC ANALYSIS OF BARITE NODULESSeveral pieces of barite nodules were found in association with the hearth of the cave. They showed red discoloration and signs of natural fracturing due to thermal action. Thermomagnetic analysis was employed to examine the effect of heat on the nodule. Two pieces of barite were submitted for analysis. One was from the hearth (barite 1) and the other (barite 2) from the Paleogene marl in the Douara Basin (see Plate 1.8: 1 in this volume). Each nodule was sliced into several pieces, and two slices, one from the outer most surface and the other from the central core, were examined. Each slice is identified by a combination of numeral and letter: the numeral is the barite number and the letter indicates the external (E) or central (C) slice of each barite nodule. Experiments were performed in a vacuo of about 10-3 torr at the magnetic field of 0.7 Tesla. Figures 8. 1: 1 and 8.1:2 show the thermomagnetic curves of sample 1E. The curve in Fig. 8. 1: 2 is drawn on an expanded ordinate scale. The barite crystal itself is diamagnetic so that the observed ferromagnetic properties are those of the magnetic minerals included in the nodule. All the samples displayed characteristic curves, that is, the heating curve is cone-shaped at temperatures above 400° and the cooling curve, whose Curie temperature is above 550°C, rises sharply (Fig. 8. 1: 1).
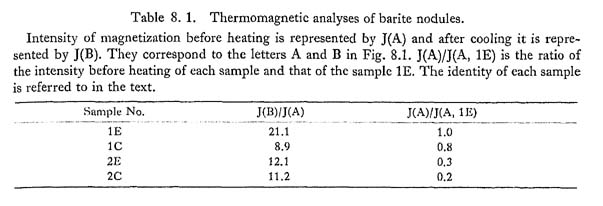
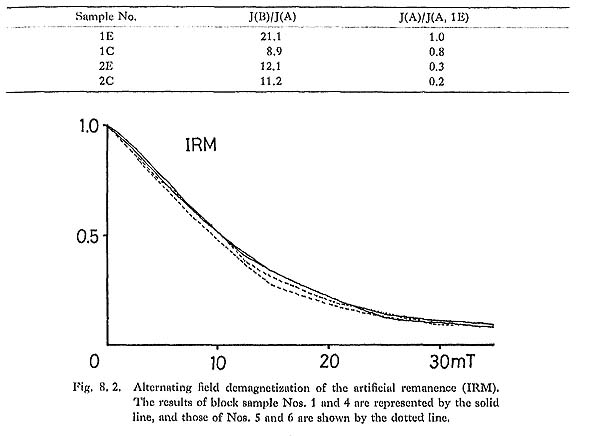
In Table 8. 1, J(B)/J(A) shows the ratio of magnetic intensity after the experiment to that before the experiment. The relative intensities of each sample before heating are also tabulated against that of sample 1E in terms of J(A)/J(A, 1E). The magnetic intensity of barite 1 is much stronger than that of barite 2. Also, the intensity of the exterior sample 1E is stronger than that of the central sample 1C. From the intensity differences between these two samples it was concluded that barite 1 might have been secondarily heated in the hearth.
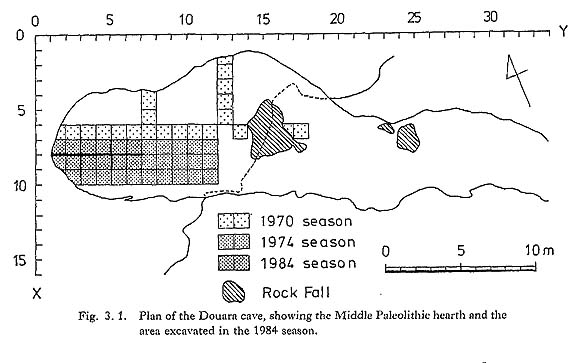
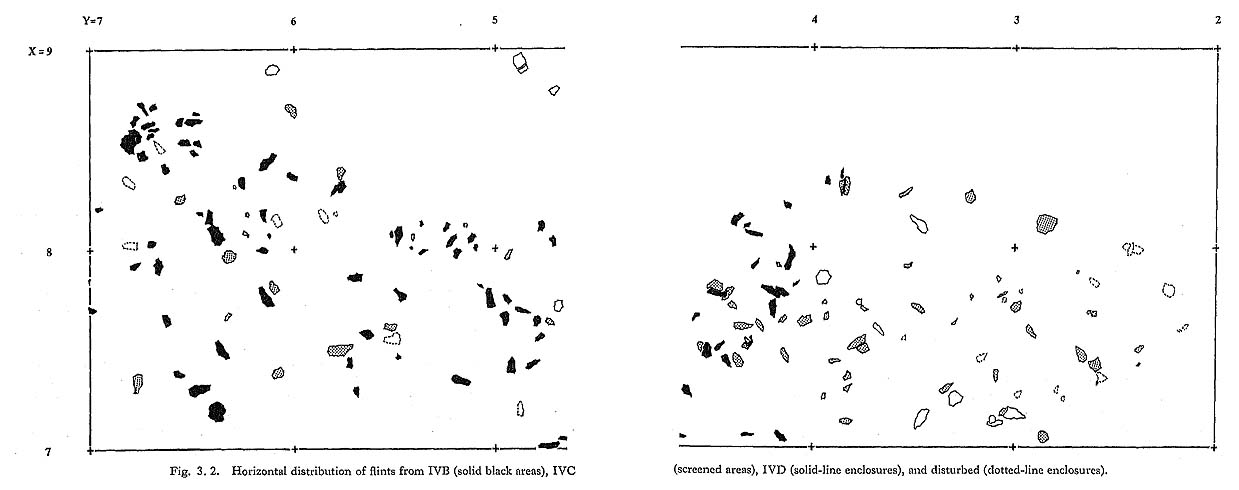
Magnetic minerals oxidized at low temperature are usually characterized by the thermomagnetic curve seen in Fig. 8. 1 (see also Ozima and Ozima, 1971). Low temperature oxidation of magnetic minerals is facilitated by water (Ozima and Ozima, 1971), which suggests these barite nodules were synthesized under moist circumstances. These magnetic minerals are unstable when heated. That is, once they are heated over 400°C, the cone-shaped curve disappears, and the heating and cooling process becomes reversible. The fact that samples 1 and 2 both had the same kind of thermomagnetic curve indicates that the barite nodule from the hearth may not have been heated over 400°C. 8. 3 BAKED EARTHEight cubic blocks of baked earth whose orientation had been noted at the hearth were used as samples. Sampling techniques and method are described in Chapter 3 in this volume (see also Figs. 3. 1 and 3. 2 in this volume). First, the natural remanent magnetization (NRM) of each block sample was measured by an astatic magnetometer. The magnetic components of all the planes were measured for each block sample. The magnetic vector in sample Nos. 2 and 6 showed a quite inhomogeneous distribution. This result may have been caused by a partial collapse in the baked earth. Later, each sample was cut into cubic specimens having an edge length about 24 mm and connected by gypsum in the laboratory. In this process, the samples from the collapsed region were dininated. Finally, five to seven specimens were cut from each block sample. These specimens were identified by integer number and decimal. Specimens cut from the same block sample were numbered with the same integer (Table 8. 3).
These specimens were then analyzed by the following methods: 1) alternating field demagnetization of artificial magnetization; 2) thermal demagnetization; 3) Thellier's experiment. Measurement of the remanent magnetization was performed by the Shonstedt Spinner magnetometer SSMl of Toyama University. An explanation of the results follows. 8. 3. 1 Field demagnetizationAs the artificial remanence, isothermal remanent magnetization (IRM; acquired under H=0.5 Teala) was added to the specimens and their alternating field demagnetization curves were compared. Results of Noa. 1, 4, 5, and 6 are shown in Fig. 8. 2. The ordinate shows the relative intensity of the IRM after the progressive alternating field demagnetization, and the abscissa is the peak value of the alternating field. The demagnetization curves of the IRM do not differ much between block samples with the exception of Noa. 5 and 6, whose curves are under those of the other specimens. This may have been caused by the difference in the heating effect on the magnetic minerals between these samples (Nos. 5 and 6) and others.
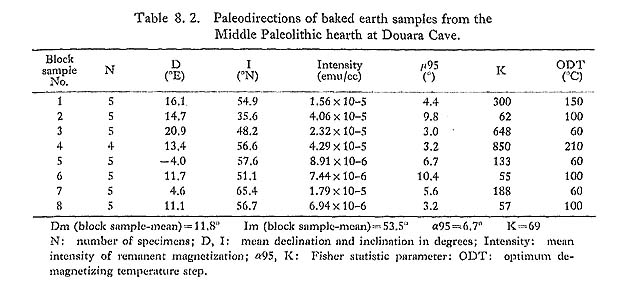
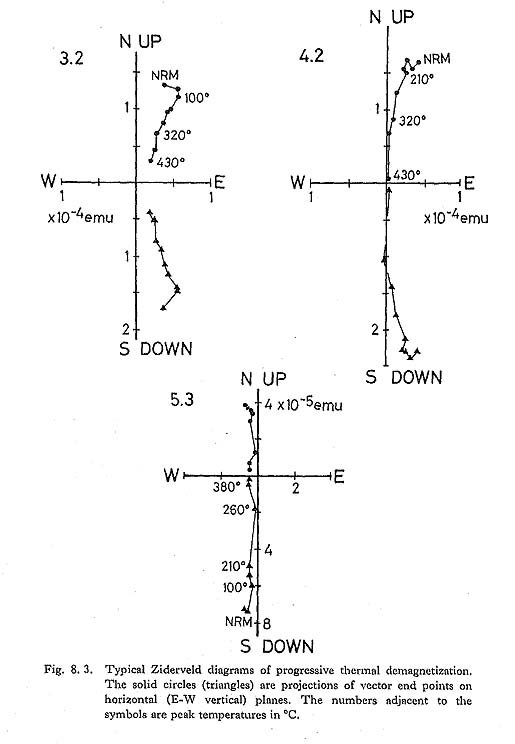
8. 3. 2 Thermal demagnetizationThe thermal demagnetization method was applied to four or five specimens of each sample. Temperature steps of 60, 100, 150, 210, 260, 320, 380, and 430°C were used. Figure 8.3 shows typical examples of the experiment as seen in Zidervelt (1967) diagram. The plots show directional changes of magnetization by demagnetization. Plots of the higher demagnetizing temperatures are almost on a line toward the origin in each of the specimens, suggesting that the remanent magnetization of each specimen consists of one stable component. For each block, the remanent directions of the specimens were averaged at every temperature step by Fisher's (1953) statistics, and the most concentrated direction was adopted as the block sample's mean value. Mean directional data, statistical parameter, and ODT (Optimum demagnetizing temperature) of each block sample are listed in Table 8. 2. ODT indicates the temperature step at which the concentrated direction was determined. Figure 8. 4 shows the remanent directions plotted on Schmidt's equal area projection. The star symbol indicates the direction at the Douara site calculated by the axial magnetic dipole. The magnetic remanences of eight block samples show a fairly grouped direction, suggesting that the hearth was not subjected to significant post-baking deformation. The mean remanent direction at the Douara site has a declination of 11.8°E and an inclination of 53.5°N. The inclination is almost concordant with the inclination estimated from the axial dipole.
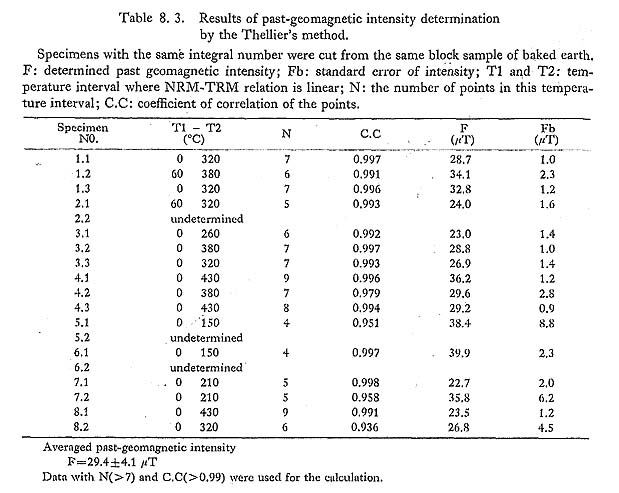
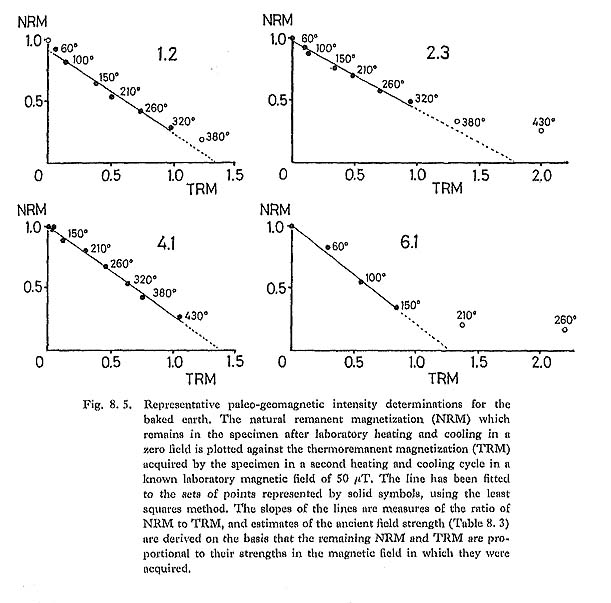
8. 3. 3 Thellier's methodThellier's method (Thellier and Thellier, 1959) is most frequently used to determine paleo-geomagnetic intensity and is also useful in estimating the heating temperature of baked earth (Sakai and Shibuya, 1983). This method compares the intensity of natural remanent magnetization (NRM; original magnetization residue in the baked earth) with thermoremanent magnetization (TRM; newly acquired in the laboratory). The comparison between NRM and TRM is made at several temperature ranges. Then, we can estimate the maximum temperature which the linear relation between TRM and NRM can be obtained. This temperature is regarded as the original heating temperature of the sample examined. Figure 8. 5 shows NRM-TRM diagrams with NRM and its thermally demagnetized component on the ordinate and the TRM as the abscissa. The numbers near the points give the laboratory heating temperatures in °C. The maximum temperature which the linear relation between NRM and TRM can be obtained becomes the estimated past heated temperature. This linear relation can sometimes be prevented by the alteration of magnetic minerals in the laboratory heating process. In this case, the estimated temperature becomes lower than the actual past heating temperature. In this study, Walton's (1978) method was adopted to monitor the alteration of the magnetic minerals and altered remanence was eliminated as much as possible when estimating the linear relation. The paleointensity data are shown in Table 8. 3.
The heating temperature of the baked earth is estimated to be between 320°C and 430°C in specimens Nos. 1, 2, 3, 4, and 8. It is lower than 250°C in specimens Nos. 5, 6, and 7. As shown in Table 8. 3, the NRM intensities of specimens Nos. 5 and 6 are rather weaker than the others. The weak intensities and estimated low temperatures indicate that samples Nos. 5 and 6 were not heated very much in the hearth. These samples were collected from a region about 50 cm lower than that of the other samples, probably near the bottom of the hearth. The heating temperature of the center of the hearth may have been over 430°C. The slope of the linear relation in the NRM-TRM diagram is used to estimate geomagnetic intensity when the hearth was heated. The present NRM-TRM analyses used 19 sample specimens, and a reliable linear relation was obtained from 16 of these (Table 8. 3). The paleogeomagnetic intensity when Douara Cave was inhabited was calculated as 29.4 µTesia by averaging the data with N>7 (correlation coefficient over 0.99 in Table 8.3). This estimated intensity accounts for about 65% of the present intensity. 8. 4 CONCLUSIONS1. The barite nodule samples from both the hearth and the basin show a thermomagnetic curve characteristic of the low-temperature oxidized magnetic minerals. This suggests that the barite nodule was synthesized in a wet environment and that the barite nodule from the hearth was probably not heated over 400°C. 2. The heating temperature of the central part of the hearth is estimated to have been over 430°C from Thellier's experiment on the baked earth samples. Samples Nos. 5 and were not subjected to much heat because the region they came from was probably near the bottom of the hearth. 3. The paleomagnetic study of Douara Cave shows that the geomagnetic field at the time when the hearth was used may have been deflected about 11.8° eastward from the geographical north. Also, the geomagnetic intensity for that time is estimated to have been about 65% of the present intensity. AcknowledgmentThe measurements were made in the paleomagnetic laboratory of Toyama University. I would like to express sincere gratitude to Professor K. Hirooka of Toyama University for valuable discussion and advice. LITERATURE CITED
|