CHAPTER 6
Comparison with Other Japanese Series
|
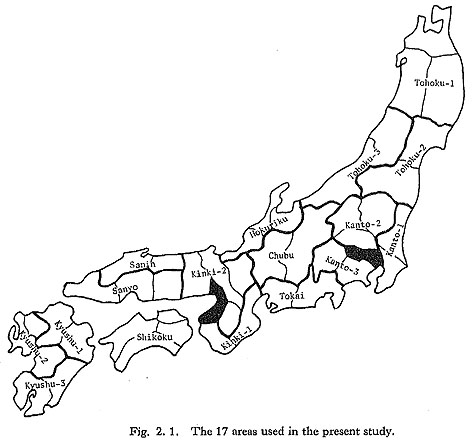
There are two nation-wide series of somatometric data other than the Nishi series: one on students by Matsumura (Matsumura, 1925), and the other on the general popuation by the National Somatometric Research Group (NSRG, 1950, 51, 52). Like the subjects of the Nishi series, the subjects of these series were measured in a relatively short period of time. For this chapter, data for the male subjects of the above two series were reclassified to conform with the 17 areas (Fig. 2.1) used in the present study. They were then analysed, and the results were compared with those in the Nishi series. The purpose was to test the reliability of the results on geographic variation obtained from the Nishi series.
1. Materials and MethodsMost of the analyses were made only on male data. A. Matsumura series (Matsumura, 1925)This series was collected by Matsumura in the years 1911 to 1917. The subjects were students 21 years of age or older, whose birth years ranged from the 1880s to the 1890s. Means and standard deviations to conform with the regional groups used in the present study were recalculated from the data by province published by Matsurnura. The number of populations is 18, i.e., the 17 populations shown in Fig. 2.1 plus Tsushima. The only somatometric variables available were height, head length, head breadth and cephalic index. B. NSRG series (National Somatometric Research Group, 1950, 51, 52)This series consists of measurements taken by the members of NSRG, supported by a grant-in-aid for scientific research from the Ministry of Education, Science and Culture. It was carried out between 1950 and 1952 in 223 locations in Japan. The subjects were 20 years in age or older, and their birth years ranged from the 1890s to the 1930s. The investigators, and the number and age of the subjects, vary in different locations, and the number of locations varies in different research areas. Therefore, the measurement values for each research area were obtained by averaging the means for the locations belonging to the area. Variances were not calculated. The number of areas is 18, including Tsushima. C. Okinawa
The subjects of the above three Okinawan series resemble those of the NSRG series in age and birth year, and in belonging to the general population. D. Nishi seriesDetails concerning the Nishi series subjects were given in chapter 2. Measured in the years from 1942 to 1945, they were students aged 18 years or older who were born in the years 1916-1926. The analyses for the present study were carried out according to the following plan:
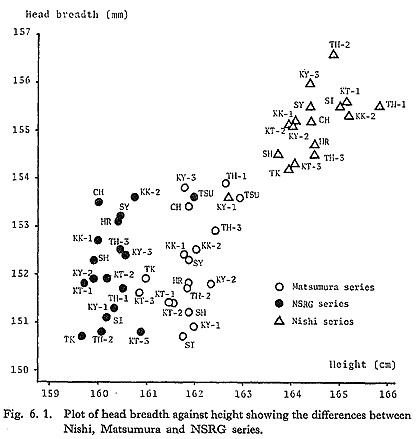
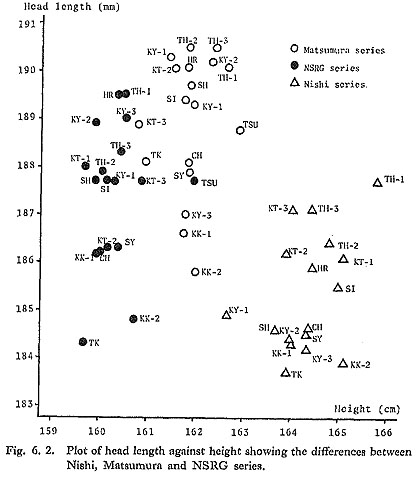
2. Results of Univariate ComparisonFigures 6.1, 6.2 and 6.3 are scattergrams of the populations of the Matsumura, NSRG and Nishi series based on height-head breadth, height-head length and head length-head breadth, respectively. They show that stature is greatest in the Nishi series, followed by the Matsumura series. The lowest values were found in the NSRG series. Values are greatest in the Nishi series probably because of secular change. The NSRG series is more recent than the Matsumura series, but values were lower probably because the subjects of the NSRG series were not students like those of the Matsumura series. The three series do not coincide in their patterns of geographic variations in height.
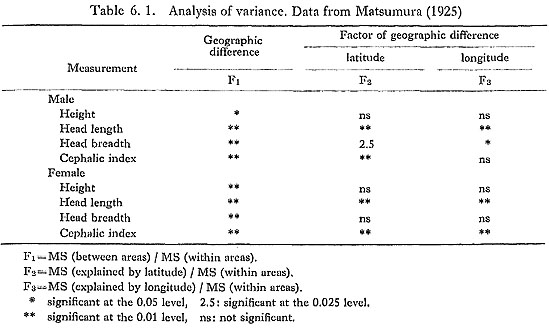
In head breadth, the Nishi series is again the largest, also because of secular change:brachycephalization. Head breadths in the Matsumura and NSRG series are nearly equal. Patterns of geographic variation in head breadth for the three series again disagree (Fig. 6.1). Head length in the Nishi series is the shortest. Head length in the NSRG series is somewhat shorter than in the Matsumura series, probably because of brachycephali zation, or because the subjects of the NSRG series were smaller in build, or both. In the three series, the populations are divided into a longer-headed group and a shorter headed group. As far as the 13 populations of Honshu are concerned, the three series agree well in the division: Tohoku-1, Tohohu-2, Tohoku-3, Kanto-1, Kanto-2, Kanto-3, Hokuriku and San'in have a longer head, while Tokai, Chubu, Kinki-1, Kinki-2 and Sanyo have a shorter head. Shikoku, Kyushu-1 and Kyushu-2 belong to the longer headed group in the Matsumura and NSRG series, but to the shorter-headed group in the Nishi series. Kyushu-3 belongs to the longer-headed group in the NSRG series, but to the shorter-headed group in the Matsumura and Nishi series. The subjects of the Nishi series are much more brachycephalic than those of the other two series, and the subjects of the NSRG series are a little more brachycephalic than those of the Matsumura series (Fig. 6.3), The pattern of geographic variation in cephalic index is quite similar to that in head length, and the three series agree with each other as follows: the populations are divided into a less brachycephalic group (Tohoku-1, Tohoku-2, Tohoku-3, Kanto-1, Kanto-2, Kanto-3, Hokuriku, San'in, Shikoku, Kyushu-1 and Kyushu-2) and a more brachycephalic group (Tokai, Chubu, Kinki-1, Kinki-2, Sanyo and Kyushu-3). The distribution pattern in cephalic index is completely different from that in body size (a dine), and seems to be a concentric circular pattern. These two groups may coincide with Kohama's Tohoku-Uranihon type and Kiriai type, respectively (Kohama, 1960). On the other hand, head length+head breadth ranges from 338 to 344 (except Tokai of NSRG series), and the differences in this index among the three series are negligible. 3. Results of Analysis of VarianceTable 6.1 shows the results of analysis of variance in the Matsumura series. The results for males are congruent with those for females: head length and cephalic index show geographic variation, but height and head breadth do not. The most remarkable difference between the results of the Matsumura and Nishi series is that height in the Matsumura series does not show geographic variation, which led Matsumura to conclude that stature did not show clear geographic difference. Correlation coefficient between the measurements of males and females is 0.74 in head length and 0.82 in cephalic index, and this indicates that the pattern of geographic variation in these variables for males coincides with that for females.
In the 17 populations of the NSRG series (excluding Tsushima), height ranges from 159.7 to 160.9 cm, and again inter-population difference is not great. In the case of the Nishi series, geographic variation was significant mainly because of shortness in height for Kyushu-1. When the shortest Kyushu-1 (162.7 cm) and the tallest Tohoku- 1 (165.8 cm) were excluded, geographic variation was insignificant. Since height does not represent body size very adequately, the non-existence of geographic variation in height does not necessarily mean the non-existence of geographic variation in body size. 4. Relationship with Geographic Position and TemperatureTable 6.2 shows the correlation coefficients between height, head length and cephalic index in the Matsumura series; weight, height, head length and cephalic index in the NSRG series; and latitude, longitude and average temperatures in January and August. As for geographic position, only head length in the Matsumura series and weight in the NSRG series show significant correlation with latitude. Since weight in the NSRG series shows significant correlation with average temperatures in January and August, geographic variation in body size is again compatible with Bergmann's rule.
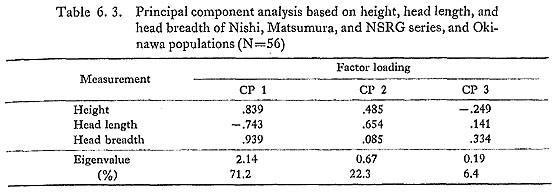
The fact that height did not show significant correlation with geographic position probably relates to the fact that the geographic difference in height was small in the Matsumura and NSRG series, and that the geographic variation in height was insignificant in the Matsumura series. Correlation between head length and geographic position was significant in the Nishi series, but insignificant in the other two series. This may be due to the fact that head lengths in the four populations of Shikoku and Kyushu were larger in the latter two series. As in the Nishi series, cephalic index did not show significant correlation with temperature in the Matsumura or the NSRG series. 5. Results of Principal Component AnalysisBecause the subjects of the Nishi series are taller and more brachycephalic than those of the other two series, the correlations between height, head length and head breadth are: r(height, head breadth)=0,75; r(height, head length)=-0.34; r(head length, head breadth)=-0.60. The results of principal component analysis (Table 6.3, Fig. 6.4) reflect this correlation. The 1st principal component, explaining 71% of the total variance, is correlated positively with height and head breadth, and negatively with head length. Since all the populations of the Nishi series have greater scores than any of the populations in the other series, this principal component is interpreted as time factor. The 2nd principal component explains 22% of the total variance and is correlated positively with head length and height. The Matsumura and NSRG series, which could not be distinguished by the 1st principal component scores, can be distinguished by the 2nd principal component scores. The 2nd principal component probably explains the difference in general body size rather than occupational difference.
The 1st and the 2nd principal components explain 93% of the total variance. Using the scores of these principal components, the general pattern of geographic variation in the three series was examined in order to determine the extent to which they coincide. Table 6.4 shows the correlation coefficients (lower left) and Spearman's rank order correlation coefficients (upper right) between the scores of the three series. In the 1st principal component score, the pattern of geographic variation in the Nishi series is not particularly congruent with those of the other two series, probably because height and head breadth (which are highly correlated with the 1st principal component) do not show clear geographic variation.
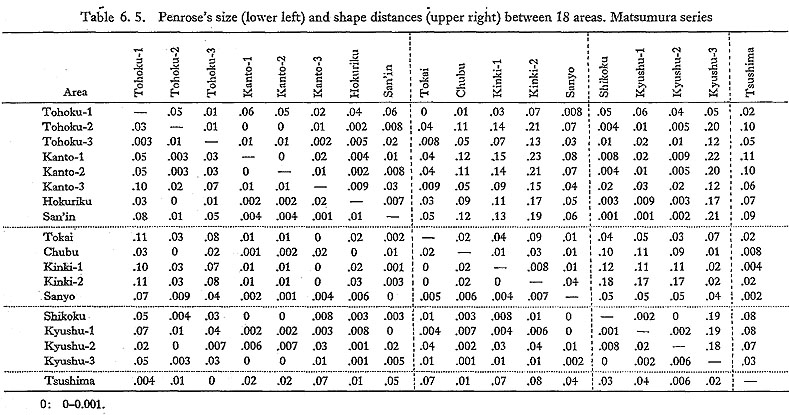
With respect to the 2nd principal component score, the three series correlate with each other significantly at the 5% level. The coincidence becomes even better when only the populations of Honshu are used. In each series, the 13 populations of Honshu are divided into two groups: one consists of Tohoku-1, Tohoku-2, Tohoku-3, Kanto-1, Kanto-2, Kanto-3, Hokuriku and San'in, and the other of Tokai, Chubu, Kinki-1, Kinki-2 and Sanyo, This grouping is practically the same as that based on head length and head breadth shown in Fig. 6.3. 6. Penrose's Size and Shape DistancesPenrose's size and shape distances for the different populations were calculated using height, head length and head breadth. Tables 6.5, 6.6 and 6.7 show the results in the Matsumura, NSRG and Nishi series, respectively. The size distances did not show any particular pattern.
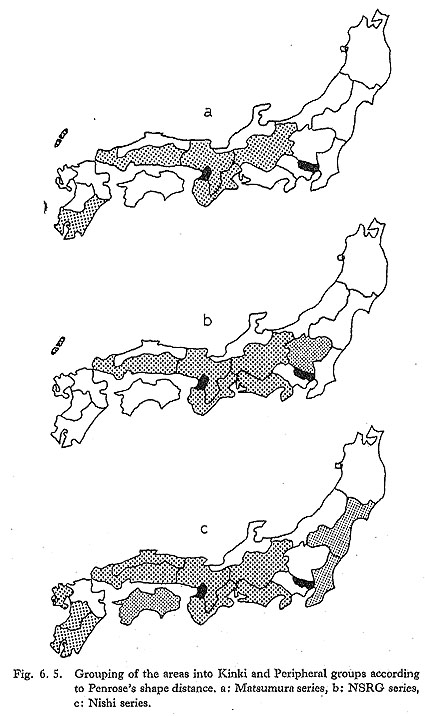
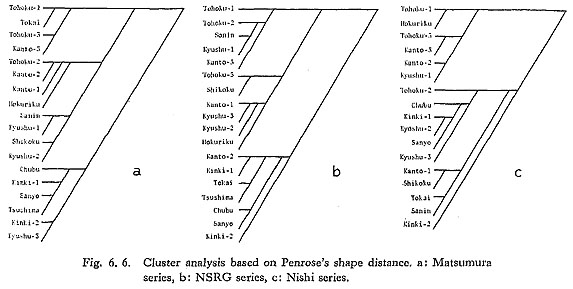
The 18 populations of the Matsumura series are divided into two groups according to shape distances: one consists of Tohoku-1, Tohoku-2, Tohoku-3, Kanto-1, Kanto- 2, Kanto-3, Hokuriku, San'in, Tokai, Shikoku, Kyushu-1 and Kyushu-2, and the other consists of Chubu, Kinki-1, Kinki-2, Sanyo, Kyushu-3 and Tsushima (Table 6.5, Fig. 6.5a). The former group, distributed in the peripheral areas of Japan, may be called the Peripheral group, and the latter, distributed mainly in Kinki district, the Kinki group. This grouping was confirmed by cluster analysis (Fig. 6.6a).
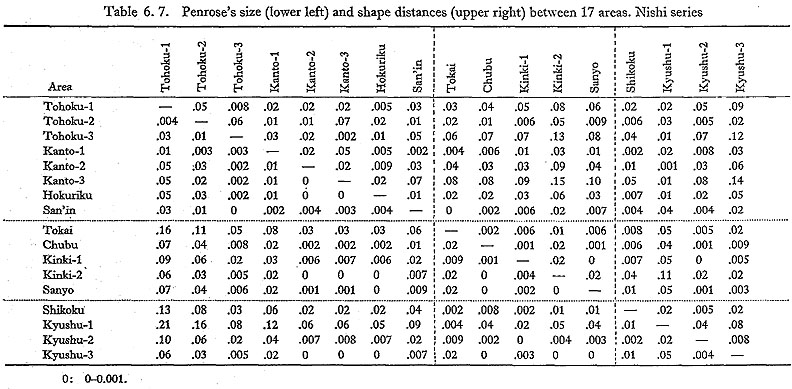
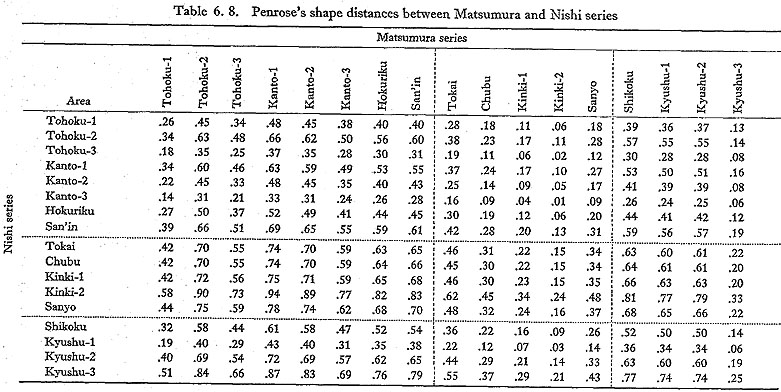
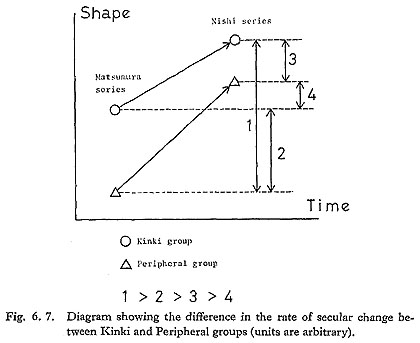
The 18 populations of the NSRG series are also divided into two groups: one consists of Tohoku-1, Tohoku-2, Tohoku-3, Kanto-1, Kanto-2, Kanto-3, Hokuriku, San'in, Shikoku, Kyushu-1, Kyushu-2 and Kyushu-3, and the other consists of Tokai, Chubu, Kinki-1, Kinld-2, Sanyo and Tsushima (Table 6.6, Fig. 6.5b). This grouping, which is very similar to that in the Matsumura series, was confirmed by cluster analysis (Fig. 6.6b). In the Nishi series, the 17 populations are divided into two groups similar to those in the Matsumura and NSRG series, and this grouping was also confirmed by cluster analysis (Table 6.7, Figs. 6.5c and 6.6c). However, the border between the two groups is much more vague, and the distances between the populations belonging to different groups are much smaller, in the Nishi series. The grouping based on Penrose's shape distances agrees very well with the concentric circular pattern observed in cephalic index. Did physical traits, then, become more homogeneous during the few decades between collection of data for the Matsumura or NSRG series and collection for the Nishi series? A possible alternative is that in the Nishi series inter-observer systematic error obscured the geographic difference, because the data for the Nishi series were obtained by many investigators. However, this alternative is unlikely, because the change in shape distance was from 10-1 (Matsumura and NSRG series) to 10-2 (Nishi series), while inter-observer error has been estimated to bring about a difference in shape distance on the order of about 10-3 (Kouchi and Hanihara, 1981). Data for the NSRG series were also collected by many investigators, and the fact that it shows much clearer geographic difference than Nishi series supports this assumption. Next, shape distances between the populations of the Matsumura and Nishi series were examined (the subjects of both series were students) (Table 6.8). Table 6.8 in dicates that the distance between the Kinki groups of the Matsumura and Nishi series is smaller than that between the Peripheral groups of the two series. This means that though the direction of secular change was the same in both the Kinki and Peripheral groups (see Figs. 6.1, 6.2 and 6.3), the rate of change was different, and also that the Peripheral group changed more rapidly than the Kinki group. Thus, the distances between the two groups of the Matsumura and Nishi series are: (Nishi-Kinki, Matsu- mura-Peripheral) > (Nishi-Peripheral, Matsumura-Peripheral) > (Nishi-Kinki, Matsumura-Kinki) > (Nishi-Peripheral, Matsumura-Kinki). Figure 6.7 shows this relationship diagramatically.
If a trait shows secular change, and if the rate of secular change differs in the Peripheral and Kinki groups, the pattern of geographic variation in that trait cannot remain unchanged. Here the possibility arises that the pattern of geographic variation clearly observed in the Matsumura series may be the product of geographic difference in the rate and timing of secular change. 7. Summary and Conclusions
|