CHAPTER 5
Nutritional Relations
|
It is probable that quality and quantity of food intake have the most direct and greatest effects on the somatological status of the human body. It is also probable that dietary pattern may reflect cultural differences, at least to some extent. In this chapter, an attempt will be made to see to what degree somatometric variables are related to intake of nutrients and dietary pattern. 1. Materials and MethodsPer capita intake of the following 10 nutrients per day were used as nutritional variables:
Daily per capita intake of the following 15 foods were used to study dietary pattern:
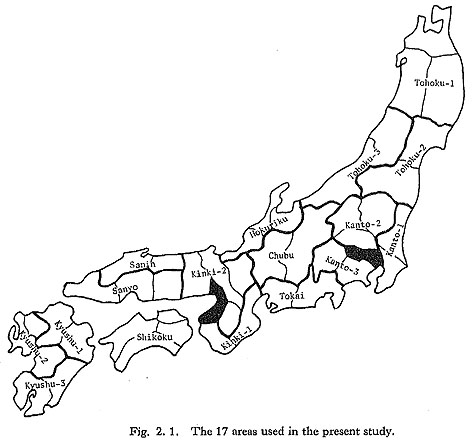
These data were taken from "Nutrition in Japan", the report of the national nutritional survey taken annually by the Ministry of Welfare. The survey was started in 1945, and became nation-wide in 1948. However, data for 12 different regional groups have been available only since 1967. The data used in this study were mean values for the 4-year period from 1967 to 1970 and the 4-year period from 1977 to 1980. Thus, the nutritional data are about 30 years more recent than the Nishi series data (somatometric surveys were made during the period from 1942 to 1945). For the somatometric and nutritional data to be comparable, it would have to be assumed that geographic variation in intake of nutrients and in dietary pattern has been stable. Because of World War II and post-war Americanization, however, dietary patterns changed drastically in the 30 years between 1940 and 1970. Therefore, the mean values were checked against the annual changes in intake of nutrients and dietary pattern as seen in the data for all Japan for the 32-year period from 1949 to 1980. In the national nutritional survey Honshu, Shikoku and Kyushu are divided into the 11 regions shown in Fig. 5.1. These regions do not correspond with those used in the preceding chapters (Fig. 2.1). Therefore, data for the Nishi male series, latitude and longitude had to be rearranged.
The following six analyses were made:
2. Results of Analysis of VarianceSince data for not only means but also standard deviations in intake of nutrients and foods are available since 1974, heterogeneity in the means of the 11 areas of Honshu, Shikoku and Kyushu was tested using analysis of variance. The data used were for 1974 and 1976. The results of F-test are shown in Table 5.1.
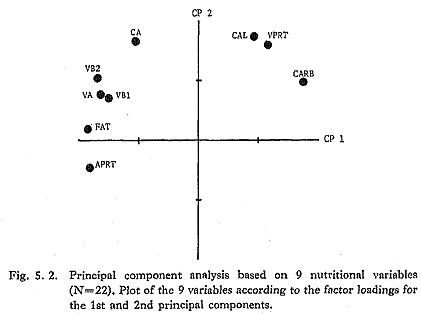
The results indicate that the means were heterogeneous in all variables. However, vitamin C and green and yellow vegetables showed insignificant F-values for both latitude and longitude. Therefore, these two variables were not used in the analysis of geographic difference. 3. Geographic Difference in Intake of NutrientsUsing the data on the 9 nutritional variables (excluding vitamin C) for the 1960s and 1970s, a principal component analysis was carried out (analysis 2). Eigenvalues and factor loadings are shown in Table 5.2. Two principal components with eigenvalues greater than 1.0 explain about 90% of the total variance. Figure 5.2 is a scattergram of the nutritional variables based on the factor loadings for the 1st and 2nd principal components. It shows that the 1st principal component is not the so-called size factor; it distinguishes the areas where intake of carbohydrate, vegetable albumin and calories are high from the areas where intake of animal protein, fat, calcium and vitamins are high. On the contrary, the 2nd principal component is a size factor, and can be interpreted as a factor of quantity of nutrient intake.
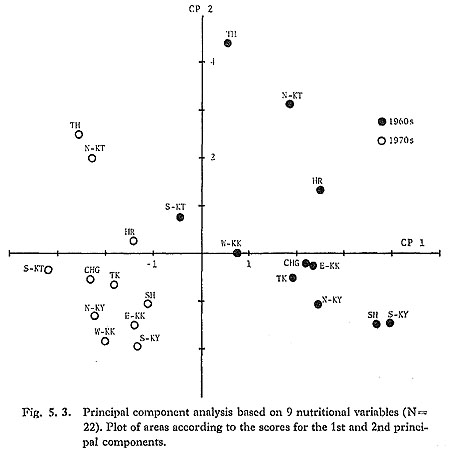
Figure 5.3 is a scattergram of the areas based on the 1st and the 2nd principal component scores. The 1st principal component scores (NT1) of the 11 areas in the 1960s are positive, whereas those in the 1970s are negative. Therefore, it can be considered that the 1st principal component represents the effects of time. On the other hand, the 2nd principal component represents the effects of geographic difference. Since the 1st principal component explains 57% of the total variance and the 2nd principal component 32%, the time effects seem to be greater than the effects of geographic difference.
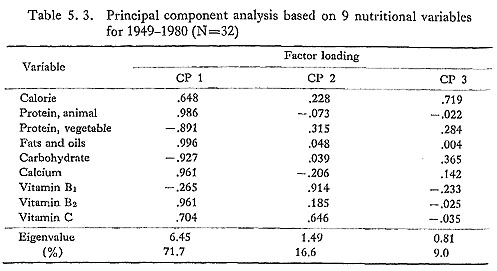
Figure 5.3 shows that the pattern of geographic difference for the 11 areas in the 1960s is very similar to that in the 1970s. In both cases, the 2nd principal component scores (NT2) of the Tohoku, northern Kanto and Hokuriku areas are positive, and those of the remaining areas are negative, so that this principal component distinguishes the western part of Japan from the eastern part. Similarity in the pattern of geographic difference between the 1960s and 1970s may mean that the pattern was stable, or may merely indicate that a time lapse of 10 years is too short to detect a change. If the difference between the 1960s and the 1970s was considerable when compared with the change between 1940 (when somatometric data were obtained) and 1970 (when nutritional data were obtained), then the stability of the pattern of geographic variation in intake of nutrients would be more probable, Consequently, an attempt was made to determine what places the 1960s and 1970s occupied in pattern of secular change of nutrient intake for the 32 years from 1949 to 1980. The data used were intake of the 9 nutrients (vitamin A was excluded) for all Japan in the 32 years from 1949 to 1980. Once again, principal component analysis was employed. The results are shown in Table 5.3.
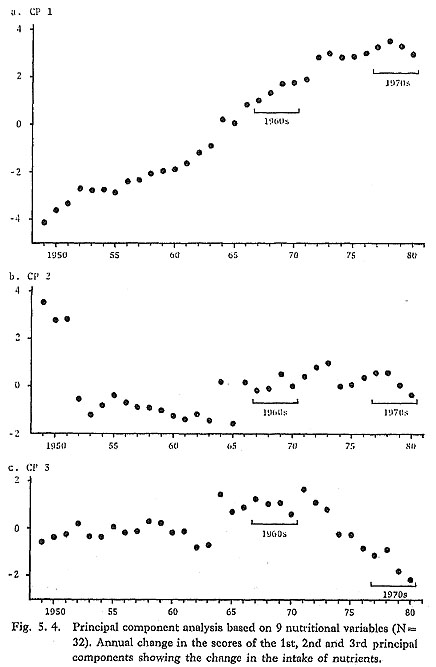
The first three principal components with eigenvalues greater than or near 1.0 explain respectively 72%, 17% and 9% of the total variance. Figures 5.4a, b and c show the secular change in the 1st, 2nd and 3rd principal component scores. The years for which data were used in the analysis of geographic difference have been underlined. The 1st principal component (CP1) shows the change in intake of nutrients: calories, animal protein, fats and oils, calcium, vitamins B2 and C increased, while carbohydrate and vegetable albumin decreased. Since 1949, CP1 score has been increasing (Fig. 5.4a). The 2nd principal component (CP2) represents the intake of vitamins B1 and C. CP2 scores in the 3 years from 1949 to 1951 were very high; then the score became low, and again increased in the middle of the 1960s (Fig. 5.4b). The 3rd principal component (CP3) represents the change mainly in calorie intake, CP3 score was stable between 1949 and the middle of the 1960s, high in the latter half of the 1960s, and has been decreasing since the middle of the 1970s (Fig. 5.4c).
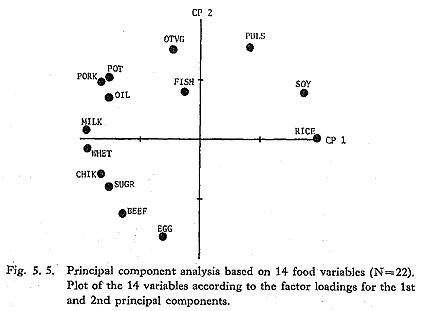
The above results show that the changes in the CP1 and CP3 scores between the 1960s and 1970s are considerable. Since the pattern of geographic difference in intake of nutrients was unaltered in spite of this change, there is no positive reason to assume that it was not stable. 4. Geographic Difference in Dietary PatternIt is probable that the cultural tradition determines the kind of foods to be consumed in order to fulfill the nutritional requirement, and thus a geographic difference in dietary pattern may reflect a cultural difference. Therefore, a principal component analysis based on data on the 14 food variables for the 1960s and 1970s was carried out (analysis 4). The results are shown in Table 5.4. Three principal components with eigenvalues greater than 1.0 explain about 90% of the total variance. Figure 5.5, a scattergram of the food variables based on the factor loadings for the 1st and the 2nd principal components, shows that the 1st and the 2nd principal components are not the so-called size factor, but represent differences in dietary pattern. The 1st principal component is positively correlated with rice and soy sauce, and negatively correlated with wheat, potatoes, oils and fats, meats, eggs, and milk. The 1st principal component can be considered to represent the decrease in the proportion of traditional Japanese foods. On the other hand, the 2nd principal component distinguishes the areas where intake of pulses, vegetables, potatoes and pork are high from the areas where intake of eggs, beef and sugars are high.
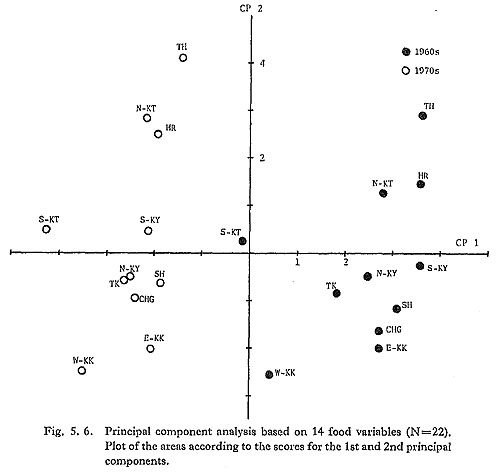
Figure 5.6 is a scattergram of the areas based on the 1st (FD1) and the 2nd principal component scores (FD2). The 1st principal component scores (FD1) of the 11 areas in the 1960s are positive, whereas those in the 1970s are negative. Therefore, the 1st principal component represents the effect of time. The 2nd principal component represents the geographic difference, and the pattern of geographic difference for 11 areas in the 1960s corresponds very well with that in the 1970s, FD2 apparently dis tinguishes the western part of Japan (having negative scores) from the eastern part (having positive scores). However, in this case, the scores of the Kyushu, Tokai and Shikoku areas are rather close to those of estern Japan, and the two areas of the Kinki District have the smallest scores.
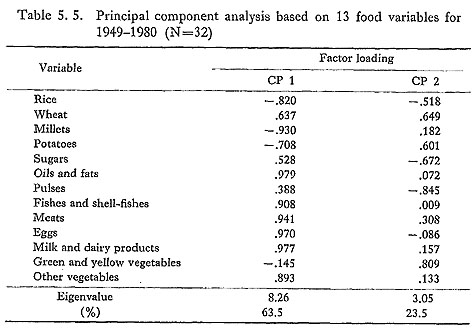
Next, a principal component analysis based on intake of 13 food variables for all Japan in the 32 years from 1949 to 1980 was carried out to determine what places the 1960s and 1970s occupied in pattern of secular change of food intake. Food variables used were rice, wheat, millet, potatoes, sugars, oils and fats, pulses, green and yellow vegetables, other vegetables, fish and shellfish, meats, eggs, and milk and dairy products. The results are shown in Table 5.5.
The first two principal components with eigenvalues greater than 1.0 explain 64% and 23% of the total variance, respectively. Figures 5.7a and b show the secular change in the 1st (CP1) and the 2nd (CP2) principal component scores. The change in dietary pattern represented by CP1 is such that intake of oils and fats, fish and shellfish, meats, eggs and milk and dairy products increased, while intake of rice, millet and potatoes decreased. In other words, the proportion of animal foods increased. Since 1949, CP1 score has been increasing, particularly in the early 1950s and 1960s (Fig. 5.7a). The change of dietary pattern represented by CP2 is such that the intake of wheat, potatoes and green and yellow vegetables increased, while intake of rice, sugars and pulses decreased. CP2 score decreased rapidly from 1949 through the early 1950s, then became stable, and again increased in the 1970s (Fig. 5.7b).
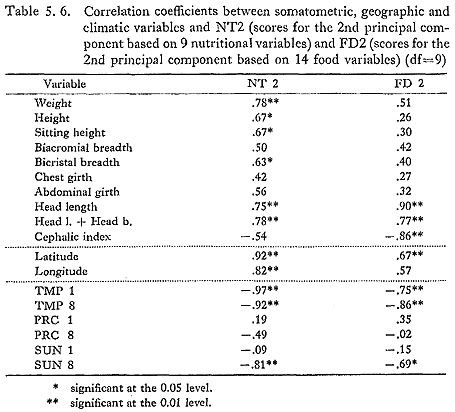
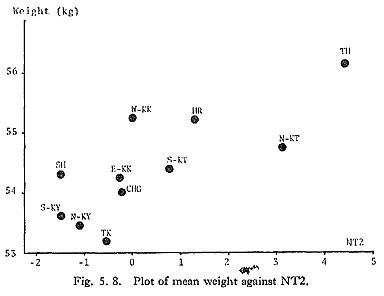
The above results show that the changes in the dietary pattern between the 1960s and 1970s are also considerable. Because the pattern of geographic difference in dietary pattern was unaltered in spite of this change, it may be safe to assume that the pattern of geographic difference in dietary pattern was stable. 5. Relationship between Intake of Nutrients, Dietary Pattern, Somatometric Variables and Climatic VariablesTo measure geographic difference in intake of nutrients, the 2nd principal component scores for the 1960s of analysis 2 (see Materials and Methods in this chapter) were used (NT2). To measure geographic differences in dietary pattern, the 2nd principal component scores for the 1960s as seen in analysis 4 were used (FD2). Correlation coefficients between NT2 and somatometric variables, latitude, longitude and climatic variables are shown in Table 5.6. The variables which show significant correlation with NT2 are 6 somatometric variables (weight, height, sitting height, bicristal breadth, head length and head length+head breadth), latitude, longitude and 3 climatic variables (average temperatures in January and August and sunshine in August). High correlations between NT2 and latitude or longitude indicate that intake of nutrients shows a northeast-southwest cline. Correlations between the intake of nutrients and temperature were the highest (higher than -0.9), which suggests that the relation between body weight and temperature revealed in the previous chapter was brought about by geographic difference in intake of nutrients. In fact, partial correlation between weight and temperature was insignificant when the measure of intake of nutrients (NT2) was held constant (Table 5.7). Figure 5.8, a plot of weight against NT2, shows a linear relationship. When NT2 was partialed out, correlations between temperature and head length or head length+head breadth also became insignificant. Cephalic index did not show significant correlation with intake of nutrients.
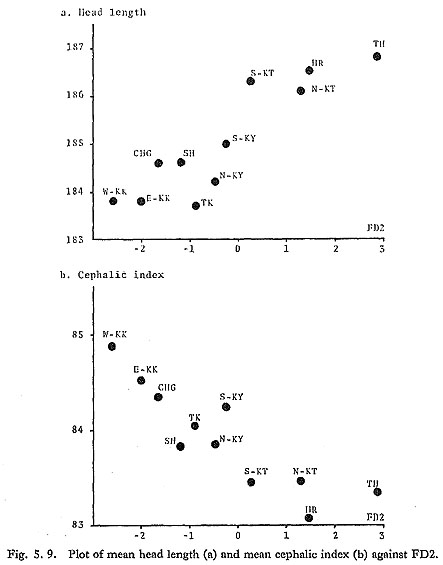
Correlation coefficients between FD2 and somatometric variables, latitude, longitude, and climatic variables are also shown in Table 5.6. Three somatometric variables (head length, head length+head breadth and cephalic index), latitude and 3 climatic variables showed significant correlation with FD2. Correlation between dietary pattern and head length was the highest (0.90), followed by correlation between dietary pattern and cephalic index (-0.86). Figures 5.9a and b show plots of head length and cephalic index against FD2, respectively.
High correlation between cephalic index and FD2 is not enough to prove the existence of a causal relation. However, it does at least suggest that it is possible to explain the concentric circular distribution pattern of the cephalic index by factors which are related to cultural environment. 6. Summary and Conclusions
|