CHAPTER 7
Comparison with Asian Populations
|
In this chapter, somatometric data on Japanese subjects are compared with those on other Asian populations. The purpose is to clarify 1) whether the geographic differences between Japanese local populations are great enough for postulating Japanese heterogeneity, and 2) to determine which Asian populations may be related to the Japanese in terms of sornatometric variables. 1.Materials and MethodsMeasurements on 139 Asian populations were used (Table 7.1). Original publications are given in Appendix V. Since the magnitude of secular change was unknown in these populations, only data collected in the years between 1930 and 1960 were used. The available data for Formosan aborigines were collected after 1950, but the data for most of the remaining populations were collected in 1930s and 1940s. The subjects of each population came from a restricted area, and in most cases were members of the general population aged 20 years or more. Generally the age range was wide, and age structure varied in different populations, Japanese populations were the same as those used in chapter 6.
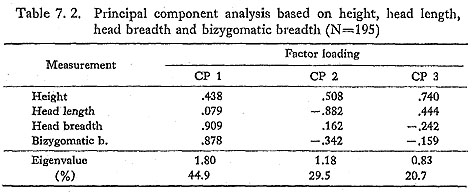
The number of the measurement items available for all the above populations was not great. Height, head length, head breadth and bizygomatic breadth were used in this study because these were available in most of the cases and had small measurement errors. A correlation matrix between height, head length, head breadth and bizygomatic breadth was analysed by principal component analysis. To study the relationship between the populations and to separate the similarity in size from that in shape, Penrose's size and shape distances between main racial groups were calculated using the first three principal component scores. 2. Results of Principal Component AnalysisTable 7.2 shows the results of the principal component analysis. The first three principal components explain 95% of the total variance. The 1st principal component (CP1) is correlated with head breadth and bizygomatic breadth, and contrasts populations having a broad head and face with those having a narrow head and face. The 2nd principal component (CP2), negatively correlated with head length and positively with height, contrasts tall and short-headed populations with short and long-headed ones. The 3rd principal component (CP3) is correlated with height and head length, and contrasts tall and long-headed populations with short and short-headed ones.
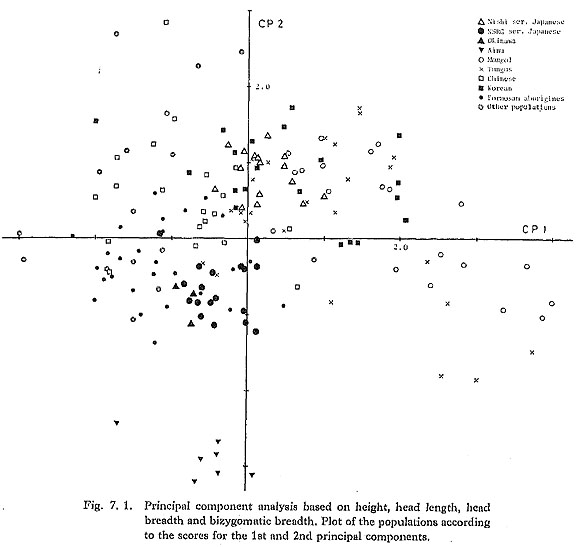
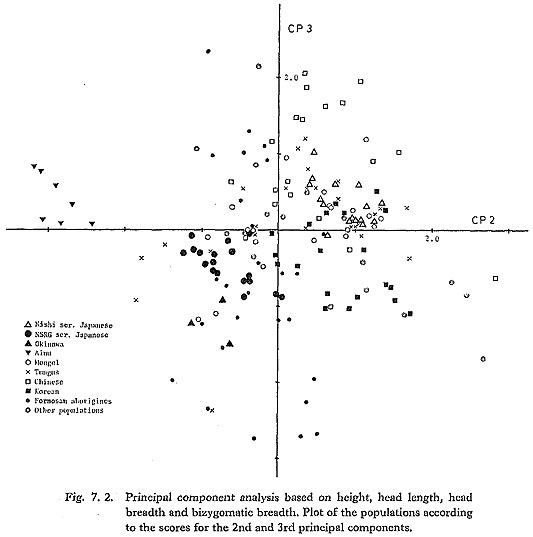
Figures 7.1 and 7.2 are scattergrams of the populations based on the scores of CP1 and CP2 and the scores of CP2 and CP3, respectively. They indicate that, in both the Nishi and NSRG series, geographic difference is not extraordinarily great in comparison with non-Japanese populations. They also indicate that the Nishi and NSRG series agree with each other in the distribution pattern of the 13 populations of Honshu in the scattergrams. However, the most outstanding fact illustrated by the figures is that the Nishi and NSRG series, which differ in time by only a few decades, are considerably different from each other. It may be no exaggeration to say that the difference between the two series is on the same scale as racial difference.
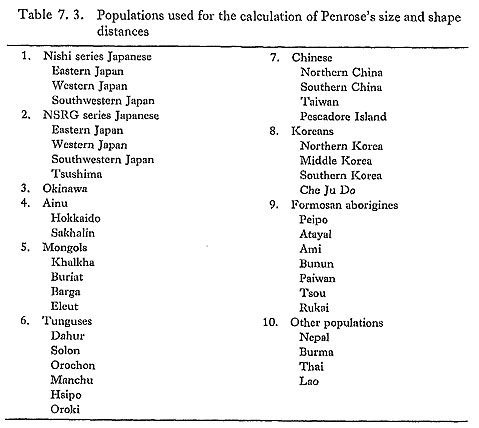
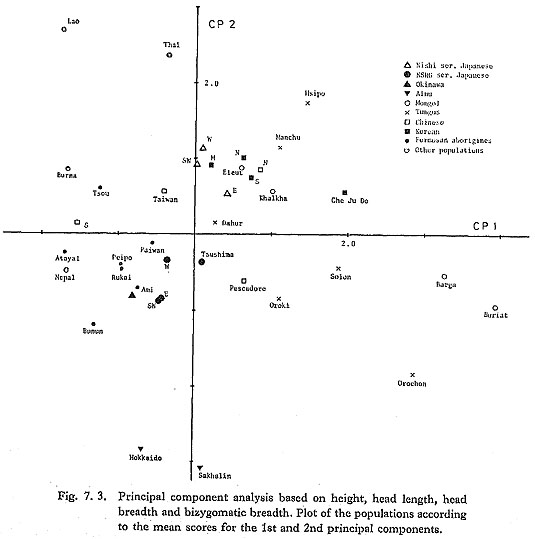
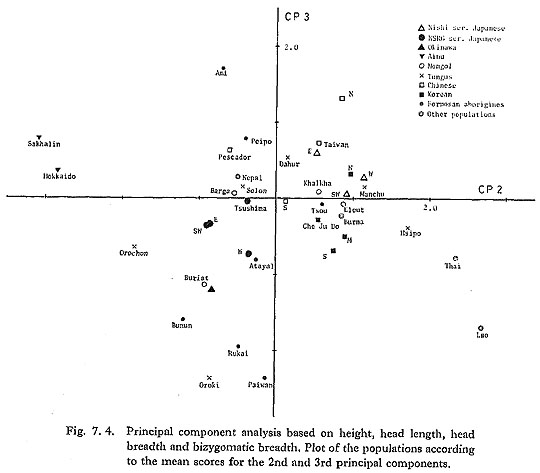
Next, all populations were combined into 39 supergroups (Table 7.3) in order to simplify the relationship between the racial groups. The means of the scores of groups belonging to each supergroup are plotted in Figs. 7.3 and 7.4. Japanese populations were combined into 5 supergroups as follows: 1) eastern Japan (Tohoku-1, Tohoku-2, Tohoku-3, Kanto-1, Kanto-2, Kanto-3 and Hokuriku); 2) western Japan (Tokai, Chubu, Kinki-1, Kinki-2, Sanyo and San'in); 3) southwestern Japan (Shikoku, Kyushu1, Kyushu-2 and Kyushu-3); 4) Tsushima; and 5) Okinawa (Honto, Hateruma Is. and Yonaguni Is.).
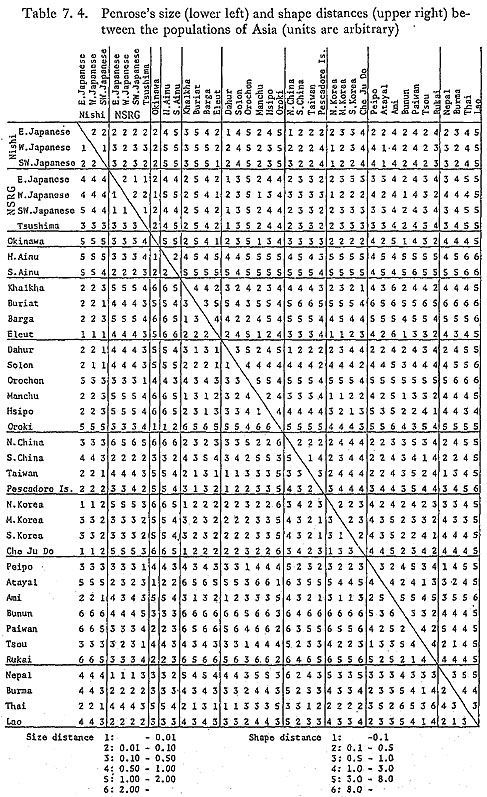
Figures 7.3 and 7.4 indicate that the three supergroups of Nishi series Japanese are similar to Koreans, North Chinese, Chinese in Formosa, Khalkha, Eleut, Manchu and Dahur, and are different from Ainu, while the four supergroups of NSRG series Japanese and Okinawans are similar to Formosan aborigines and South Chinese. From Kohama's theory (Kohama, 1960), one would expect Japanese to be located between Koreans and Ainu, Japanese from eastern Japan being closer to Ainu and Japanese from western Japan to Koreans. Contrary to this expectation, however, the subjects of all the Japanese series, including subjects from Okinawa, are very different from Ainu. Because the Nishi and NSRG series are considerably different from each other in the values of principal component scores and similar to different racial groups, principal component scores may be considered to be inadequate as a measure of phylogenetic relationship. 3. Penrose's Size and Shape DistancesPenrose's size and shape distances between the 39 supergroups were calculated using the scores of the first three principal components to separate similarity in size from that in shape. In calculating the distances, the three principal components have the same weight irrespective of their eigenvalues. Table 7.4 shows the size distances (lower left) and shape distances (upper right) in an arbitrary 6 grade unit between the supergroups.
In size distance, Nishi series Japanese are more similar to populations of Mongols and Tunguses, Chinese, Koreans, Ami and Thai than to NSRG series Japanese. Again, NSRG series Japanese are more similar to Sakhalin Ainu, South Koreans, Nepalese, Burmans and Lao than to Nishi series Japanese. The Tsushima subjects of the NSRG series are somewhat different from the other three groups of the NSRG series. Oknawans are more similar to Ainu, Oroki, Atayal, Paiwan and Rukai than to other Japanese groups. Therefore, size distance is also considered to be inadequate as a measure of phylogenetic relationship, for the same reasons as in the case of principal component scores. In shape distance, all Japanese groups of the Nishi and NSRG series, as well as Oldnawans, resemble the same racial groups: they are similar to Eleut, Dahur, Manchu, North Koreans, Bunun and North Chinese, and are different from Lao and Thai of Southeast Asia and Ainu. Shape distance is generally considered to represent phylogenetic relationship better than size distance (Sneath and Sokal, 1973; Corrucini, 1973), and the present results support this opinion. 4.Summary and Conclusions
|