PART I. SEASONAL DATING METHOD
III. Daily Formation of Growth Lines
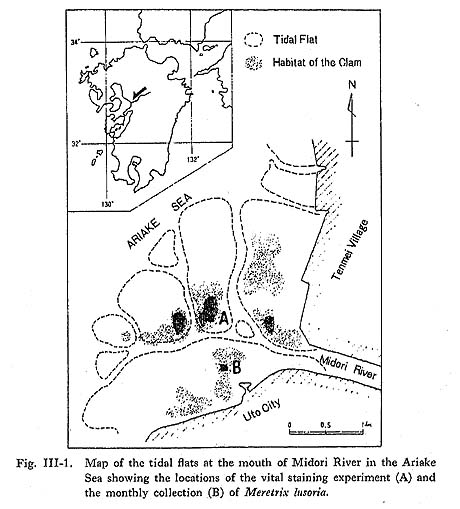
III-1. Vital Staining ExperimentFor the investigation of the periodicity of growth lines we used a marking method that enabled us to compare the number of growth lines between the marked lines and the shell margin directly with the number of days of the experiment (Davenport, 1938; Pannella and MacClintock, 1968). A vital staining experiment (Koike, 1973) was carried out on the clam, M. liisoria, on a tidal flat at the mouth of the Midori River in the Ariake Sea, Kyushu (Fig. III-1). The staining solution was prepared from a saturated solution of alizarin red S (Hidi and Hanks, 1968; Barnes, 1972; Buddemeier and Kinzie, 1975) diluted about 1,000 times with sea water in the field. The clams were immersed in the solution for 30 minutes or more and then returned immediately to a selected locality in the field.
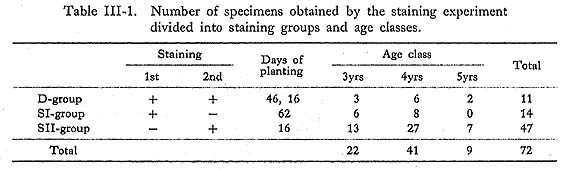
The first set of 140 clams was stained on May 24, 1971, and 40 marked clams were collected on July 9, 46 days after staining. They were stained again together with 50 new clams. On July 25, 16 days after the second staining, 72 stained clams were col lected and used for study. The 72 recovered shells were sorted into three groups: double-stained shells (D group) planted for 46 days and 16 days, the first single-stained shells (SI-group) planted for 62 days, and the second single-stained shells (SII-group) planted for only 16 days. Numbers and ages by group are listed in Table III-1. The age of the clam was deter mined by counting the growth lines, and is presented as a calendar year. For example, a clam which survived 3 winter seasons is considered to be a 4th-year shell (see Chapter V-3).
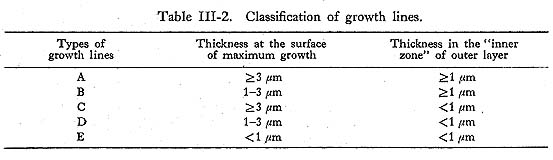
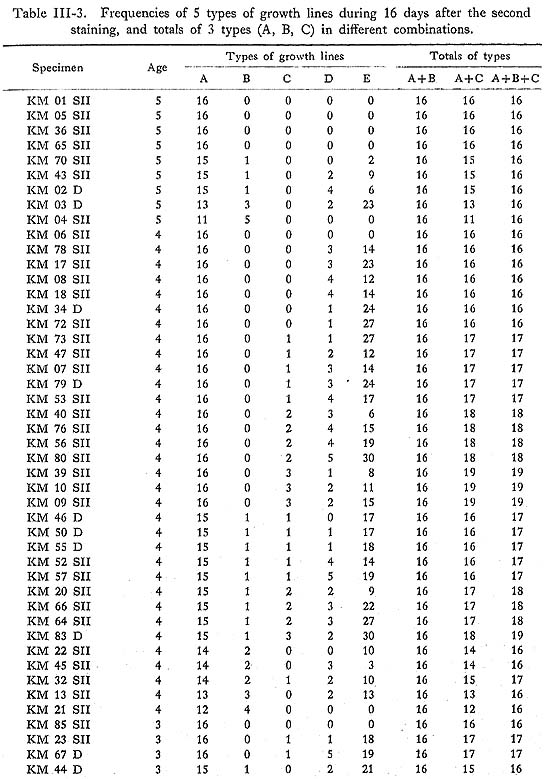
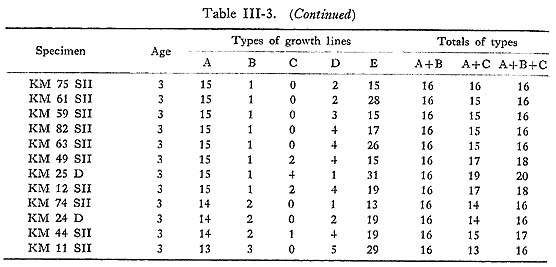
As already noted, the shape of growth lines changes at the closing surface, from the reflecting form near the surface of maximum growth to the slanting form in the inner zone of the outer layer. The thickness of growth lines near the surface of maximum growth is variable, ranging from conspicuous to barely visible, while the thicknesses in the inner zone appear rather uniform. Closer observation of these lines reveals that the conspicuous lines near the surface of maximum growth extend well into the inner zone, but that the fainter lines near the surface of maximum growth narrow gradually, particularly in the vicinity of the inner zone, becoming barely visible or invisible. In order to examine variation in the thicknesses of the growth lines themselves, those thicker than 1 µm were measured both along the surface of maximum growth and in the inner zone using a measuring microscope on SEM photomicrographs of the surfaces etched with HCl solution (Koike, 1973). Five types of growth lines, Types A to E, can be distinguished based on line thickness as shown in Table III-2, The frequencies of these five types of growth lines were examined in 58 specimens for the 16 days after the second staining (Table III-3). Type A lines plus Type B lines invariably equaled 16 days in a given specimen, and those lines can be regarded as growth lines of a primary order formed with a daily periodicity, while Type C, D, and E lines are of a secondary order which appear irregularly between Type A and B lines.
III-2. Daily Growth IncrementsThe daily growth can be expressed as the thickness of the daily growth increment along the surface of maximum growth. Measurements were made with an ocular micro meter with a minimum scale of 5 µm, and the thickness was read to about 2.5 µm at 200 magnification. Measuring errors due to replica technique, measurement procedure and differences between right and left valves of the same individual were less than 3 µm, sufficient to permit measurement with an accuracy of 2.5 µm. When the thicknesses of the daily growth increments during the planting period are plotted against calendar dates of the staining groups and age classes (Fig. III-2), the patterns of growth are similar for individuals of the same age class, although there are some individual variations. The thinner increments crowd together on the chart, and thicker increments increase at almost the same time, with variation increasing as the thickness of the increments increases.
To examine the effect of staining on shell growth, the thicknesses of daily growth increments during the first 3 days after the second staining were compared between the stained groups (D and SII groups) and the non-stained group (SI group). There are slight differences in the mean values of the increments between the stained groups (45-50 µm in the 4th-year shells; 55-60 µm in the 3rd-year shells) and the non-stained group (55-60 µm and 65-75 µm in the 4th- and 3rd-year shells, respectively), but the differences are not statistically significant. Moreover, thicknesses for the 3 days just after the first staining were the same as those before the staining. Therefore, the effect of the staining on the thickness of the daily growth increments can be neglected. Individual differences in the absolute values of daily growth are due mostly to the age of the shells. The daily growth increments just after the first staining, or during a period of slow growth, were about 15 µm in the 5th-year class, 30 µm in the 4th-year class, and 40 µm in the 3rd-year class. During the periods of relatively rapid growth in late June and the middle of July, the thicknesses varied greatly from 25 to 50 µm in the 5th-year class, from 50 to 200 µm in the 4th-year class and from 100 to 200 µm in the 3rd-year class. The daily growth of the younger shells shows greater changes than that of aged shells and is thought to be more useful for analysis of the relationship between daily growth and environmental factors. Because 3rd-year shells are the most abundant in the Jomon shellmounds, the following discussion will deal mostly with thedaily growth increments of the 3rd-year shell. The pattern of the mean values of the daily growth of 3rd-year shells showed a tendency to increase gradually from 30 µm at the first staining (May 24th) to 50 µm in the middle of June. The mean values then increased rapidly in late June, continuing at about 150 µm for 5 days before dropping rapidly to half of the thickness in early July. From the 19th of July to the date of collection, the mean values rose again to 180 µm; however, individual variation tended to increase. III-3. Subdaily Growth LinesThe presence of secondary growth lines (Type C, D and E lines) was examined on the photomicrographs of the replica films for the 72 stained specimens. The positions of secondary growth lines within each daily growth increment were recorded for the entire planting period, as exemplified by the KM 12-SII specimen (Fig. III-3).
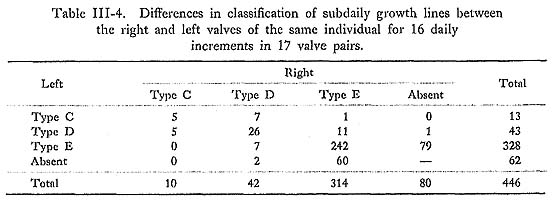
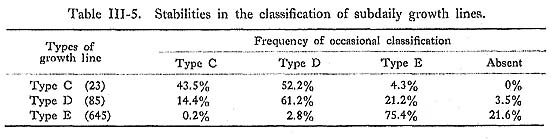
The sequences of the secondary lines in the right and left valves seem to correspond well, as seen in sample 12-SII. The degree of coincidence in the subdaily growth lines of Types C, D, and E (Table III-4) was about 43.5%, 61.2%, and 75.4%, respectively, while there were frequent alternations of Types C-D, D-E, and E-Absent (Table III-5).
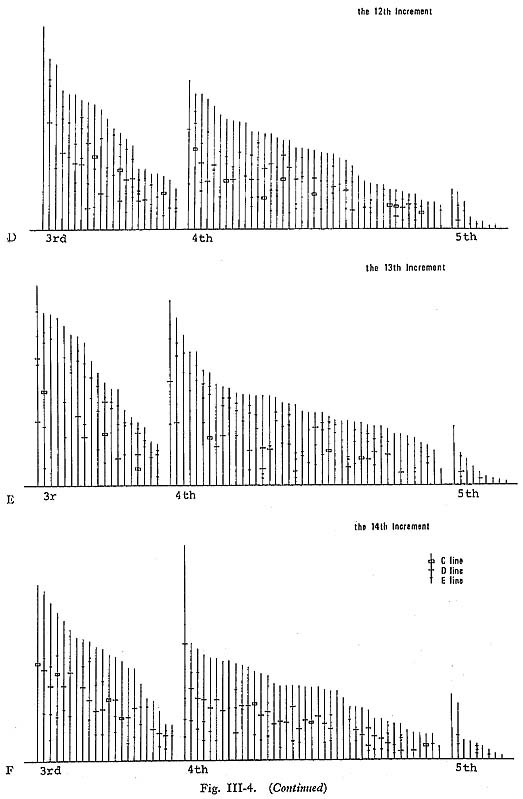
As already mentioned, the frequencies of subdaily growth lines varied greatly among specimens. For example, the number of Type E lines in different specimens during 16 days of planting ranged from 0 to 40. Additionally, the presence of subdaily growth lines tended to decrease in older clams, making 4th-year shells the most useful for further examination of the patterns of subdaily growth lines. The daily frequencies of the secondary lines showed that Type C lines were very rare (averaging 0.05 lines per day, per specimen), except in the 1st and llth to 14th increments, where they were more common. The Type D lines appeared more fre quently (0.16 lines per day) and tended to increase in the same increments as the Type C lines (the llth to 14th increments). Type E lines were most abundant (1.07 lines per day) and increased with the thickness of the daily increment. In order to examine the daily peculiarities of secondary growth lines in detail, their locations within each growth increment were compared (Fig. III-4). In the 4th and 8th increments (Fig. III-4-A), Type E lines were relatively high in number in pro portion to the thickness of the daily growth increment. They seemed to be concentrated in the middle and later portion of the increment, although it was difficult to find correspondences among specimens. In the 11th increment (Fig. III-4-B), where the thickness of the daily increment increased sharply, Type C and D lines had a tendency to appear near the middle of the increment (in 34 of the 72 specimens). Type C and D lines also appeared in the middle or later portions of the 12th increment (27 specimens) (Fig. III-4-C). In the 13th increment (Fig. III-4-D), Type C and D lines appeared near the middle of the increment (27 specimens), and 2 distinctive lines composed of Type E or Type D lines were present in the later portion (37 specimens). In the 14th increment (Fig. III-4-E), Type D lines and occasionally Type C lines appeared near the middle of the increment (42 specimens).
In other words, secondary growth lines of Type C and sometimes of Type D were often present in the middle of the daily growth increments. Type E lines were usually found elsewhere within the increment, often in the vicinity of the daily growth lines. In certain increments, secondary growth lines had peculiar locations, such as 2 distinctive lines in the later portion of the 13th increment in many specimens. Local environmental records, including sea-water temperature, tidal range, and rainfall, were used to examine the influence of these factors on daily shell growth and the presence of the subdaily lines (Fig. III-5). During the planting period from early July, the sea-water temperature increased from 20°C to 30°C, and the thicknesses of the daily growth increments increased from 25 µm to 150 µm in the 4th-year shells. This showed a rough correlation between the sea-water temperature and shell growth, especially during late June when the temperature rose sharply, and the thicknesses of the daily increments also increased rapidly from about 50 µm to about 150 µm. In the later half of the planting period, 2 peaks in growth were observed. The first peak from June 23 to July 5 corresponds with the spring tide, and the second peak from June 20 to the date of collection corresponds with the neap tide. There were several heavy rains during the planting period, but the pattern of growth did not suggest any clear correlation with rainfall, or with salinity. These results are tentative; clarification of the effects of environmental factors on the daily growth increment requires study of the data covering a full year.
III-4. Identification of Daily Growth LinesThe basic problem in starting a study of growth increments is distinguishing growth lines formed in a rhythmic periodicity from disturbed ones. In the present investigation, growth lines were classified according to their thicknesses, both along the surface of maximum growth and in the inner zone of the outer layer-that is, inside the closing surface. When disturbances in the outer environment cause the shell to close, inhibiting shell growth, a thin disturbance line would be formed. These subdaily growth lines are most visible near the surface of maximum growth, but barely visible in the inner zone inside the closing surface. Therefore, the daily formation of the growth lines seems to be best reflected inward from the closing surface, where effects of the outer environment are weak. Appearance of growth lines Types A and B in M. lusoria indicated that growth increments probably reflect solar periodicity. Artificial lighting (Clark, 1975), valve movement (Thompson, 1975) and feeding activity (Uno, 1962) experiments demonstrated an underlying biological rhythm related to the solar day. Although these observations suggest that shell formation had basically solar periodicity, growth increments also record lunar periodicity sometimes interrupted by tidal exposure under intertidal conditions. The thinner Type C lines in the 13th and 14th increments during the second staining period, for example, appeared near the middle of daily growth increments suggesting that they are disturbance lines formed during tidal exposure (Pannella, 1975). The degree of tidal influence on shell formation must correspond to intertidal conditions such as the tidal range and the tidal level of the habitat of a species (Farrow, 1972; Dolman, 1975). The growth patterns of benthonic animals living in a higher tidal zone (Clinocardium edule) will wholly correspond to tidal exposure (Evans, 1975). |