CHAPTER VII GRAIN SIZE DISTRIBUTION CHARACTERISTICS OF THE SANDS AROUND THE DOUARA CAVE
Yo UESUGI
Department of Geography, Faculty of Science, The University of Tokyo
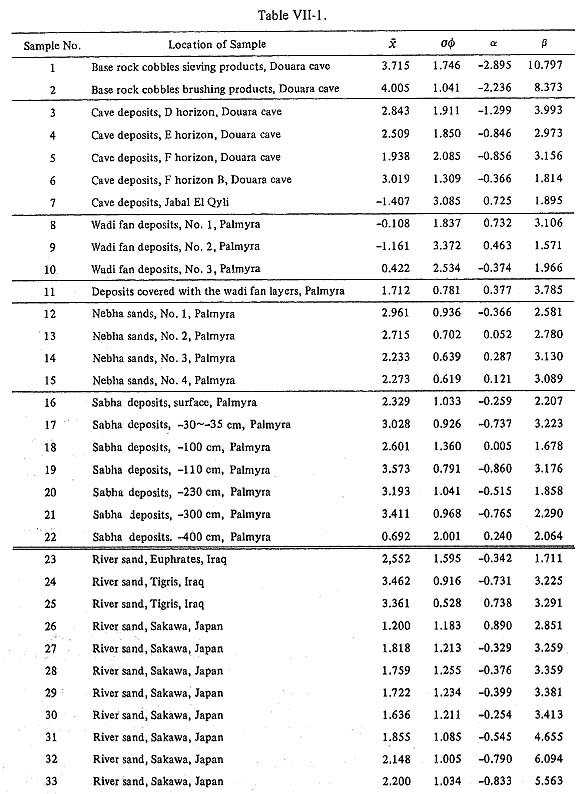
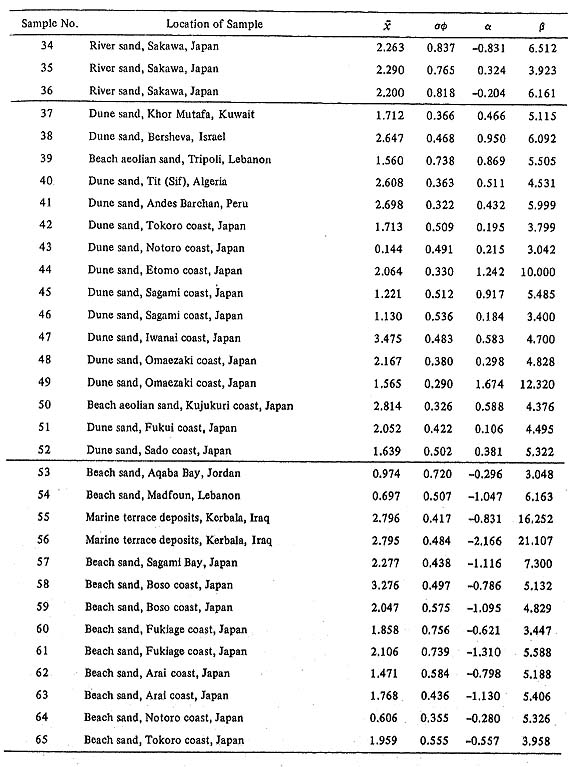
1. INTRODUCTIONTo serve as an aid to recognize the natural environments under which the paleolithic men of the Douara cave lived, 20 samples collected from the cave, wadi fan, Nebha and Sabha in Palmyra district and 3 base rock cobbles of the limestone in the Douara Cave were submitted to the author for the grain size analysis. Many contributions have been made during the past thirty years on the relationship between grain size distributions of sediments and depositional processes. And a number of methods have been proposed to determine the depositional environment from the characteristics of grain size distributions. The author considers that one of the fruitful approach at the present is to investigate the relationship between weathering processes at the provenaces and various environments in sedimentary basins and moreover to analyse the texural responses to weathering and depositional processes. But this approach requires many samples from every major depositional or weathering site in Palmyra district, and moreover, several kinds of observations and experiments in the field or laboratory must be performed. However, sample numbers submitted to the author are insufficient for this approach. Thus, this discussion is a preliminary one for the above mentioned approach, and 43 samples in the other districts are used for comparison. 2. PROCEDURE63 samples were collected from dunes, rivers, ocean beaches, caves, wadi fan, Nebha and Sabha, and 2 samples were produced artificially. The location of the samples is indicated in Table VII-1.
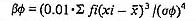
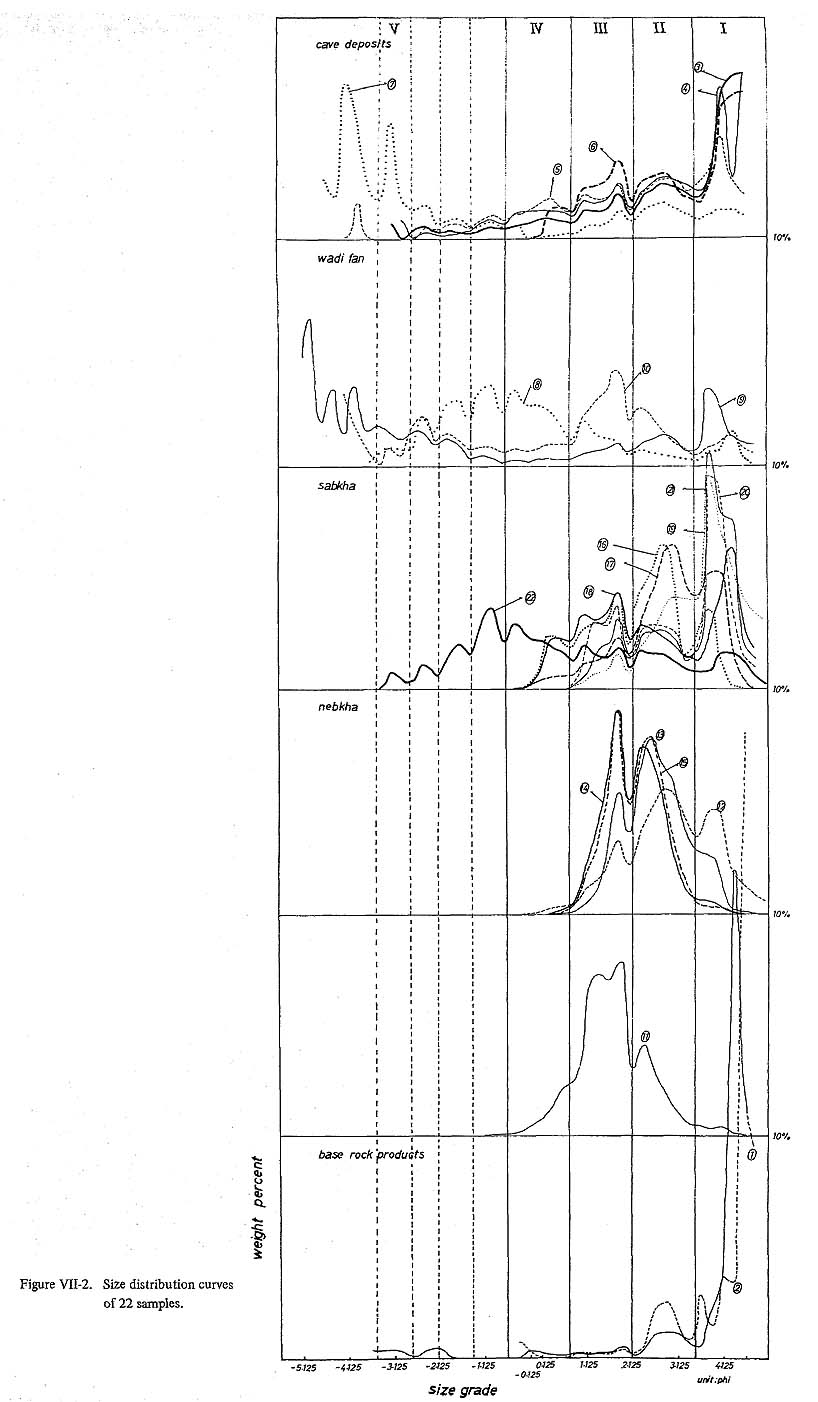
In the laboratory, every sample was oven dried. The salt rich samples were washed several times in fresh water before oven drying process. Grain size determinations were made by conventional sieving methods, using quarter phi sieve intervals. Every sample was sieved for 10 minutes each on a ro-tap sieving machine. 100 grams of each sample was used for materials of sand or silt size. And in case of the gravel size materials, ca. 200 grams of each sample was used. The grain size data obtained were transformed to the phi-scale.(1) The four statistical parameters, including mean, standard deviation, skewness, kurtosis of each grain size distribution curve were computed by the moment method. (see Table VII-1) Mean (the first moment) is defined by the equation Standard deviation (the second moment) is the square root of the mean of the squared deviations from the mean and is expressed by the equation Skewness (the third moment) which describes the symmetry of the grain size distribution curve is defined statistically as the average of the cubed deviations from the mean divided by the cube of the standard deviation and is expressed by the equation Kurtosis (the fourth moment) which measures peakedness of the grain size distribution curve is expressed by the equation 3. RESULTS AND DISCUSSION1) Analysis of Curve ShapesFigure VII-1 and Figure VII-2 show the mean and the individual grain size distribution curves of 22 samples in Palmyra district (including 2 artificial samples), respectively. These two figures indicate that a number of modes and sags exist in grain size distributions, and that these modes and sags are fixed to the definite size grades, in spite of the various natures of the 22 samples. It is there suggested that there is a deficiency of particles in the definite size grades, such as 3.75~3.25φ, 2.25~2.00φ, 0.875~0.625φ, -0.50~-0.75φ, -1.25~-1.50φ, -2.00~-2.25φ, -2.50~-3.00φ, -3.25~-3.75φ.
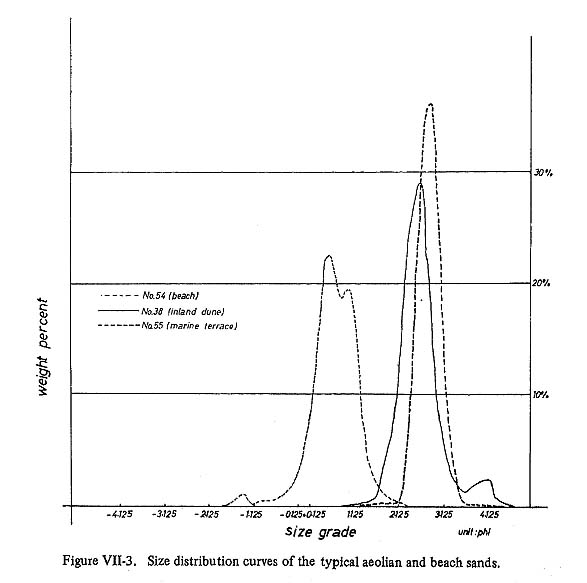
Thus, the sedimentary particles of Palmyra district are classified into five size-groups by those size grades of particle deficiency. Particles of Group I (4.50~3.75φ) is situated in coarse silt range. Particles of Group II (3.25~2.25φ), Group III (2.00~0.875φ) and Group IV (0.625~-0.50φ) are situated in fine, medium and coarse sand range, respectively. Particles of Group V is situated in gravel range and this group is divided into many sub-size-groups. Generally speaking, each size distribution in Palmyra district is determined by the combination of these five groups, and the mechanism of the combination is responsible for the mode of transportation and the energy condition of the transporting medium. On the other hand, the formation of each size-group should be explained by the existence of the definite size grades, where materials in Palmyra district are mechanically unstable in relation of weathering processes to textural response. And the absolute volume and volume ratio of each size group is also expected to be mainly determined on the denudation areas, such as mountain slopes. Figure VII-2-1 shows the size distribution curve of the artificial chipping product which were produced from the base rock cobbles by 80 minutes 20 seconds sieving in the pan. This size distribution curve shows the same size grades of particle deficiency as those of the other natural sediments. And it is composed of a large amount of Group I, a medium amount of Group II, and a small amount of Groups III and V. Figure VII-2-2 shows the size distribution curve of another artificial product which was produced from the weathered crusts of the base rock cobbles in the Douara cave by brushing. This product also shows similar combination rate to the sieved one. These two artificial products suggest relatively rich production of Group I in Palmyra district, especially in the mountain slope or in the cave. The size distribution curves of the Douara cave materials are indicated in Figures VII-2-3, VII-2-4, VII-2-5, and VII-2-6. All the five size groups appear. The essential mode is composed of Group I, and the other four Groups form the accessory modes. This type of curves does not appear in the sediments which are under the high sorting energy, such as in the typical channel, aeolian, and wave field conditions. This type represents probably the gravitational fall out environment, such as talus. It is thus concluded that every particles produced in the cave by chemical decomposition and physical disintegration, have been randomly deposited on the floor. Figures VII-2-8,VII-2-9, and VII-2-10 represent the size distribution curves of the wadi fan deposits. Every size group appears in these curves. The essential modes exist in coaser size grades as compared with the Douara cave deposits. The Primaly mode is composed of Group III, Group IV or Group V. This type of curves does not appear under the above mentioned high sorting energy. Figures VII-2-12, VII-2-13, VH-2-14 and VII-2-15 represent the size distribution curves of the nebha sands. And Figures VII-2-16, VII-2-17, VII-2-18, VII-2-19, VII-2-20, VII-2-21 and VII-2-22 were obtained from the boring core samples of the sabha area. Figure VII-2-22, which was obtained from the sample of the depth of 400 cm is remarkably different from the curves of the other samples. It resembles to the wadi fan curves. This sample may probably belong to old wadi fan deposits covered with the sabha or nebha layers. The nebha sand is usually regarded as the aeolian sands surrounding the inland lake. The nebha deposits are the best sorted ones in Palmyra district and composed of Group I, Group II and Group III. The primary mode is composed of Group II or Group III. The sabha deposits lack Group V, and their primary mode is composed of Group I or Group II. The main part of Group IV and Group V were abandoned at the wadi fan area and mountain slope area, including the cave, and only Group I, Group II, Group III and the mall part of Group IV reaches the nebha and sabha areas. Therefore these two kinds of deposits are more sorted than the other types of deposits. However, these two kinds of deposits are not so well sorted as the deposits in the typical aeolian or beach environments (see Figures VII-3-1, VII-3-2).
Figure VII-2-11 shows the size distribution curve of the deposits covered with the wadi fan layers. This reddish coloured sample contains many quartz particles. This curve resembles those of the nebha sands, but in this curve, the mode of Group I is not so well developed as in the nebha sands. 2) Statistical Analysis
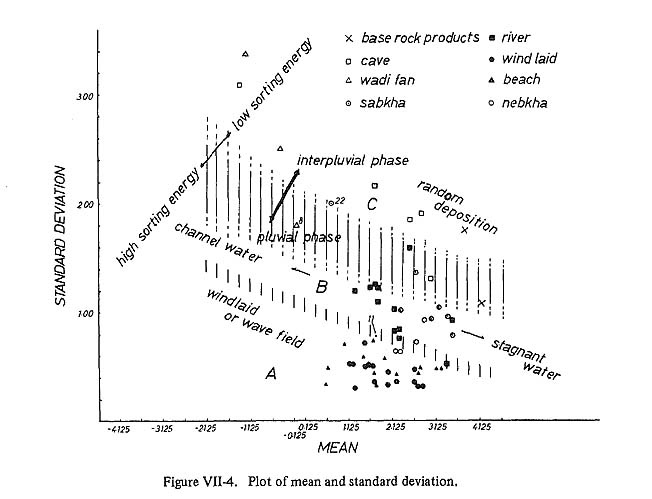
Sub-area A shows the portion of the low sorting energy. The samples in this sub-area are mainly the wadi fan deposits and the cave deposits. Sub-area B shows the portion of the middle sorting energy. The samples in this sub-area are mainly the channel deposits and the sabha deposits. Sub-area C shows the portion of the high sorting energy. In this sub-area, every beach aeolian and wave field deposits, and inland typical dune sands are plotted, Sub-area A may be the area of randam deposition such as various kinds of mudflows, talus and mountain slopes. Sub-area B is the area of the channel flow environment (coarser half) and the area of stagnant water environment (finer half). There exist one wadi fan sample (No. 8), one cave sample (No. 6, the Douara Cave, F) and two samples from the sabha area (No. 18, -100 cm: No. 22, -400 cm) in the boundary zone between these two environments. These samples were deposited under the transitional environment from the random depositional environment to the channel flow or stagnant water environment. The nebha' samples also represent the intermediate characteristics, between the channel flow or stagnant water environment and typical aeolian environment.
The deposits covered with the wadi fan layers (sample No. 11) is situated in the uppermost part of sub-area C. It is probably the deposits under the aeolian environment. ßø-σø diagram- In Figure VII-5, the standard deviation is plotted against the kurtosis of 65 samples. The plotted area is classified into three sub-areas.
Sub-area A is the area of the randam deposits, such as the wadi fan deposits, the cave deposits, and two samples which were artificially produced from the base rock cobbles. Sub-area B is the area of the channel deposits. Sub-area C is mainly occupied by the ocean beach sands, typical aeolian sands, nebha sands and sabha sands. Sub-area C is the area of high sorting energy. Sub-area B and sub-area A are respectively the area of middle sorting energy and low sorting energy. Moreover, the sample which is plotted on the right side of each sub-area shows higher peakedness than that which is plotted in the left side. The higher peakedness indicates the predominance of the specific size grade and lack of the other size grades. For example, the sabha samples which are plotted on the left side of sub-area C have four or three size groups. On the other hand, the nebha samples which are plotted on the central part have three size groups, and the ocean beach sands and typical aeolian sands plotted on the right side have only one or two essential modes as shown in Figure VII-3. The deposits covered with the wadi fan layers (sample No. 11) is plotted near the ocean beach and the typical aeolian sands. It is undoubtedly an aeolian sand. Two artificial samples are both plotted on the rightest side of sub-area A. Although they are the random deposits, their plotted area is distinctively differ from the other natural random deposits. It is because that while they were produced by single mode of particle production, such as sieving or brushing, other natural random deposits were the result of various modes of particle production. If we can observe and classify the various modes of particle production in the cave or on the mountain slope for years, it will bring us many fruitful results about the absolute volume and volume ratio of each size group, and moreover, about the influence of climatic changes in arid zone to textural response. Figure VII-5 also indicates that all natural samples collected from Palmyra district represent low peakedness. It is possibly caused by the universal existence of the coarse silt size (Group I) in this district. Weakness of the elimination media, such as perenial running water has cummulatively resulted in these universal low peakedness. During some pluvial stages, the coarse silt (Group I) will be eliminated from the wadi fan deposits. Therefore, as shown in Figures VII-4 and VII-5, the wadi fan deposits will be moved downwards to the area of channel deposits. Sample No. 8 has been collected from the wadi channel bottom during the winter rainy season. Therefore it is similar to the wadi fan deposits during pluvial stage.
3. CONCLUSION(1) The sedimentary particles of Palmyra district were classified into five size groups by the modes and sags on the size distribution curve, (see Figures VII-1 and VII-2) These size groups are as follows;
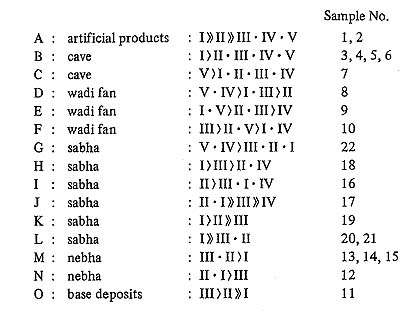
Eachi natural size distribution curve seems to be decided by the combination of these five size groups. The origin of these size groups are not sufficiently investigated. (2) Relative ratios of five size groups of 22 samples obtained in Palmyra district are as follows: The sample No. 11 is similar to the nebha sands (Nos. 13, 14, 15). The sample No. 22 which has been obtained from the deposits under 4 m from the sabha surface at the boring point is similar to No. 8 collected from the wadi fan area. It is probably the deposits of the ancient wadi fan during an interpluvial stage. Generally speaking, the cave deposits and the wadi fan deposits have all of these five size groups. On the other hand, the main parts of Groups V and IV are eliminated from the sabha and nebha deposits. (3) As shown in Figures VII-4 and VII-5, the nebha deposits, the sanha deposits, the wadi fan and cave deposits and the artificial samples produced from base rock cobbles can be clearly discriminated each other.
Note:(1) |

 is the mean grain size in phi value,fi is the weight percent of the different grain size grades percent in the material, andxi is the midpoint of each grain size grade in phi values.


 diagram
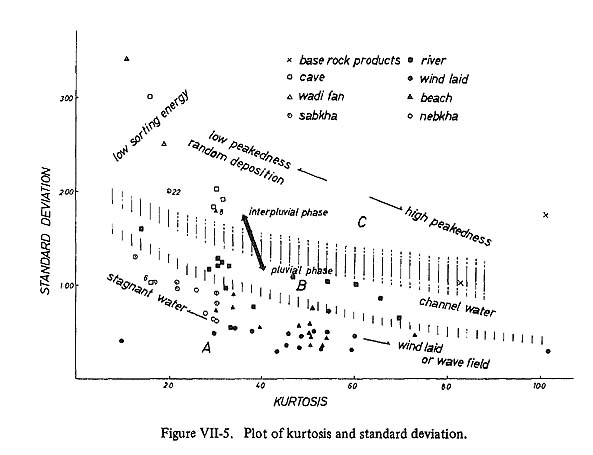
 mm= d mm, where d is the diameter of each grain.