CHAPTER II
Material and Methods
|
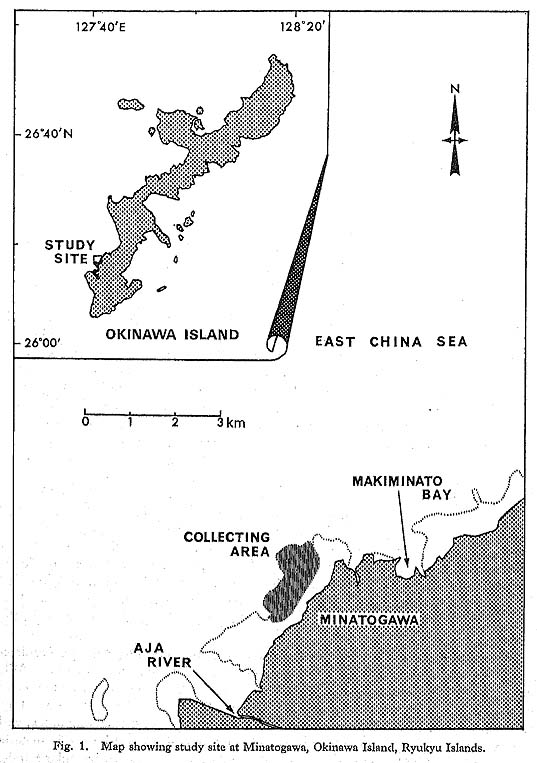
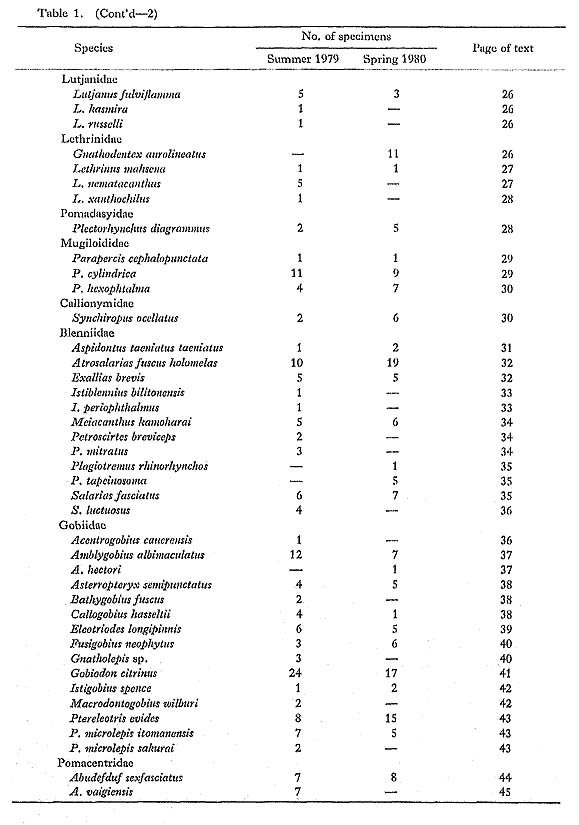
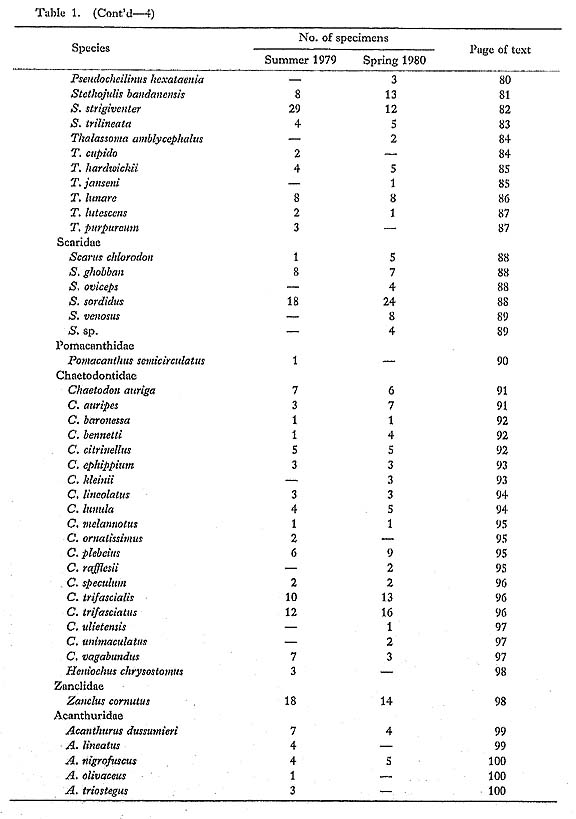
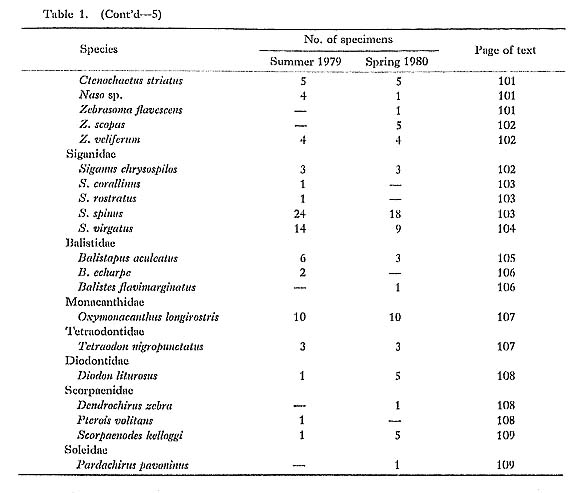
The gut contents of 1,891 fish specimens from 188 species were analyzed in detail. These fishes were collected using a 12-m × 1-m screen net and a dip net at Minatogawa on the west coast of Okinawa Island (Fig. 1), Ryukyu Islands, during August and September, 1979 (summer) and during March and May, 1980 (spring). Most fishes were collected from living coral reefs and patches, rocky reefs, and shallow sandy areas between 8: 00 a.m. and 15: 00 p.m. Collection depths generally ranged from about 2.5 m at high tide to about 1 m at low tide. A detailed description of the study site has been reported by Sano et al. (1984). The species and specimen numbers examined are listed in Table 1. All of the specimens and gut contents are deposited in the Department of Fisheries, University Museum, University of Tokyo (FUMT-P).
During collections made by snorkeling, all specimens were sealed in a plastic bottle containing 15% formalin immediately after being collected. As soon as possible after returning to the shore, gut contents of the collected specimens were preserved by injecting 100% formalin directly into the body cavity. These specimens were accurately identified as to species and the standard length was measured in the laboratory. Food items from the gut contents were identified and the percentage volume of each item in the diet was visually estimated for an individual specimen under a binocular microscope. In species with a well-defined stomach, only the stomach contents were analyzed in this study, but in species without a well-defined stomach both the stomach and intestines were examined. The gut contents were analyzed and evaluated according to the procedure of Hobson (1974). The following three values were calculated for each food item of each species: (1) the percentage of the number of specimens containing the item; (2) the mean percentage of the item in the diet volume, which was calculated by dividing the sum total of the individual volumetric percentage for the item by the number of specimensexamined; and (3) the ranking index, which was calculated by multiplying the first and second values. The higher the ranking index (10,000 at maximum), the more important the item in the diet. Specimens with empty stomachs were excluded in this analysis. In the third chapter ("Analysis of gut contents"), the following data are tabulated for most species: (1) scientific name; (2) Japanese name; (3) catalogue number (FUMTP); (4) number of specimens examined, excluding those with empty stomachs; (5) season collected; (6) range in standard length (SL); (7) number of specimens with empty stom achs; and (8) food items. The food items are listed in order of the ranking index, with some exceptions. That is, body fragments of animal organisms and inorganic material such as sand are listed in the last row of the table regardless of their ranking index value. In addition, when the mean percentage of the food item in the diet volume is less than 1%, it is symbolized by a cross mark (+), so that the ranking index is not calculated and the item is listed in order of the percentage of the number of specimens which contained the item. In the case of a species in which the number of specimens examined was three or less, the food data are described only through the mean percentage of the diet, For species whose food habits differ with season or growth, the gut contents arc segregated accordingly, The habitat (or collection place) for each species is described, except for species that occur consistently on reefs and/or patches of branching Acropora corals. The scientific names of most species follow the nomenclature used by the Ichthyological Society of Japan (1981) and those of some species follow Matsubara (1955), Allen (1975a), Burgess (1978), Hayashi and Itoh (1978), Hayashi (1979, 1982), Randall (1980), Emery and Allen (1980), Hayashi et al. (1981), and Randall et al. (1981).
|