CHAPTER 3
The Geographic Variations
|
The purpose of this chapter is to clarify 1) which somatometric variables show geographic variation, 2) whether the geographic variations in these variables are correlated with each other or not, and 3) what is the pattern of the geographic variation. Hereafter the word "geographic difference" is used when the means of the populations are heterogeneous, and "geographic variation" is used when the geographic difference shows a regular pattern related to geographic locations. 1. MethodsAnalysis of variance was used to examine the geographic difference of a variable without neglecting the intra-population variation. Since there are many books which deal with analysis of variance in detail (Kishine, 1977; Sokal and Rohlf, 1969; and others), the method is presented here only briefly. To verify the existence of a geographic difference, the null hypothesis H0:
where xij is the value of the j-th subject of the i-th population, ni is the number of the subjects of the i-th population,
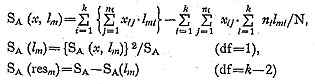
When the k means are found to be heterogeneous, the inter-population sum of suqares is divided into the sum of squares for geographic position (SA(l)) and residual sum of squares (SA(res)), and it is asked whether the variation for geograpnic position is significantly greater than the intra-population variance. Because latitude and longitude are highly correlated, latitude and longitude of the centroid of each area are used separately as measures of geographic position. The sum of squares for the geographic position (SA(lm)) and residual sum of squares (SA(resm)) are:
and F-value is:
where l1i and l2i are latitude and longitude of the i-th area, respectively. In the present analysis, variables with significant F-values for both latitude and longitude at the 1% level were considered to show a significant geographic variation, for because of large sample size the power of the test was high. Since somatometric measurement items are correlated, their patterns of geographic variation may also be expected to be correlated. To clarify the essential points of geographic variation in these measurement items, two kinds of analysis were made: first, a correlation matrix between the somatometric variables obtained from the means of the 17 populations was analysed by principal component analysis; second, a correlation matrix between the measurement items showing geographic variation obtained from the data of all subjects was analysed by principal component analysis. Principal component scores for each subject were calculated and analysed by the analysis of variance method. Finally the correlation coefficients between somatometric variables and geographic position (latitude and longitude) were calculated using the means of the 17 populations to determine whether the pattern of the geographic variations was dine or not.
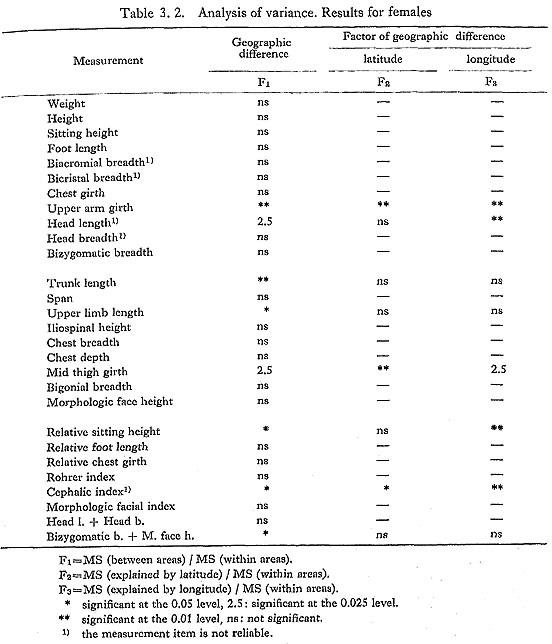
Calculations were processed by the HITAC 8800/8700 and HITAC M-200H electronic computer systems of The University of Tokyo Computer Centre. 2. Results of Analysis of VarianceThe results for males and females are shown in Tables 3.1 and 3.2, respectively. In males, nine measurement items (weight, height, sitting height, biacromial breadth, bicristal breadth, chest girth, abdominal girth, mid-thigh girth and head length) and two indices (cephalic index and head length+head breadth) showed geographic variation. Bizygomatic breadth and morphologic face height have F-values significant at the 5% level because of extraordinarily small values in the Hokuriku population. This is clear from Fig. 3.1, a plot of morphologic face height against bizygomatic breadth.
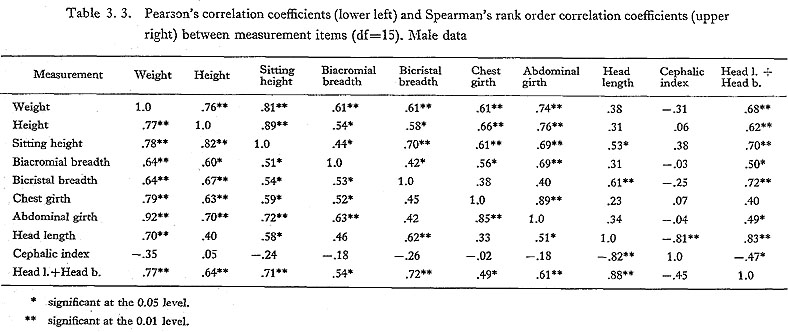
Since many of the subjects from the Hokuriku area were measured by the faculty of Kanazawa University, it is likely that the university adopted a measuring technique somewhat different from that adopted by other universities and colleges. In fact, the skulls of the Hokuriku population do not have exceptionally small bizygomatic breadth and morphologic upper face height (Commission of Anthropological Investigation of Modern Japanese Crania, 1981). When the Hokuriku population was excluded, these F-values were insignificant. Therefore, the present results indicate that the face measurements do not show geographic variation, although there remains a possibility that great measurement error masked the geographic variation. Since head breadth does not show geographic variation, geographic variation in cephalic index and in head length+head breadth probably reflects variation in head length. Somatic indices do not show clear geographic variation. The results for females are remarkably different from those for males, with only upper arm girth showing geographic variation. Possible causes of this discrepancy are the facts that data on biacromial breadth, bicristal breadth, head length and head breadth for female subjects are unreliable, that body heat regulation in females may not work in exactly the same way as in males (Schreider, 1950), and that almost all of the female subjects were students at colleges and schools in Tokyo and thus may not adequately represent their local populations. Since most of the measurement items for the female subjects did not show geographic variation, only the male data were retained for further analysis. 3. Relationship among the Measurement ItemsNext, male data on the following 10 somatometric variables were analysed: weight, height, sitting height, biacromial breadth, bicristal breadth, chest girth, abdominal girth, head length, cephalic index, and head length+head breadth. Table 3.3 shows the correlation coefficients (lower left) and Spearman's rank order correlation coefficients (upper right) among these measurement items and indices for the means of the 17 populations. The two correlations agree with each other very well, and the following four points may be made: (a) correlations between somatic measurement items are high; (b) head length+head breadth is highly correlated with somatic measurement items; (c) head length seems to be correlated with body size; (d) the cephalic index is significantly correlated only with head length.
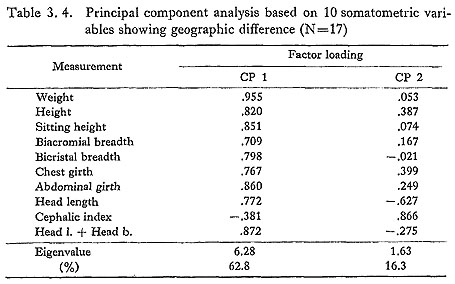
To clarify the above relationship, the correlation matrix shown in the lower left of Table 3.3 was analysed using principal component analysis. Eigenvalues and factor loadings are shown in Table 3.4 and Fig. 3.2. The 10 variables are grouped into 1) somatic measurement items, 2) head length and head length+bead breadth, and 3) cephalic index, according to the factor loadings (Fig. 3.2).
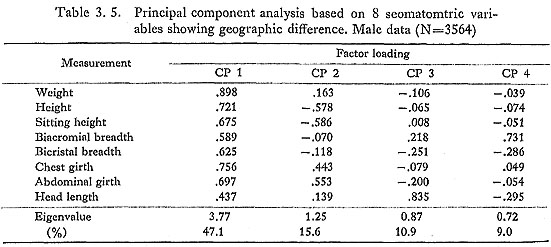
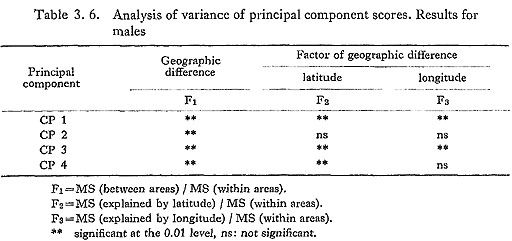
The scores of these principal components for each subjects were calculated and analysed using analysis of variance. The results of the analysis of variance are shown in Table 3.6. Since the scores of CP2 and CP4 did not show geographic variation, the geographic variations observed in the Nishi male series are summarized into two categories: 1) geographic variation in body size, and 2) geographic variation in the length of the head.
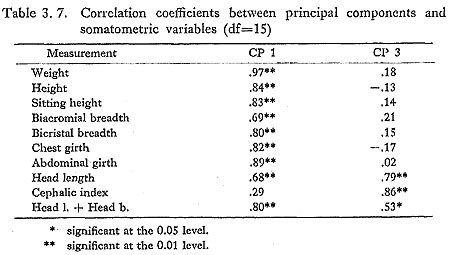
Table 3.7 shows the correlation coefficients between the 1st and the 3rd principal components and the somatometric variables based on the means of the 17 populations. CP1 (body size factor) is significantly correlated with all the somatometric variables except cephalic index, especially with weight. CP3 (head length factor) is highly correlated with cephalic index and head length. Since the correlation coefficient between CP1 and CP3 is as high as 0.51 (df=15), the geographic variations of these principal components may not be completely independent.
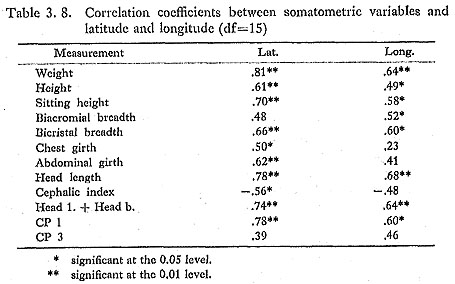
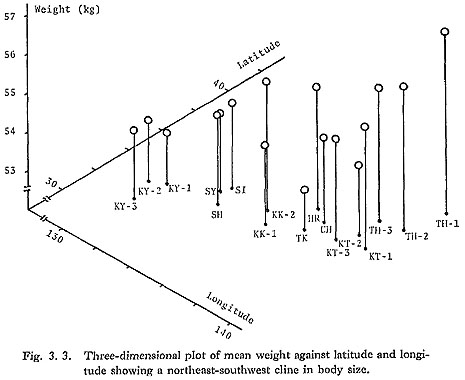
The results of the two principal component analyses are consistent with each other. 4. The Pattern of Geographic VariationTo examine the pattern of the geographic variations observed in somatometric variables, correlation coefficients between the somatometric variables and latitude and longitude were calculated (Table 3.8). Though most of the somatometric variables show significant correlations with latitude and longitude, those of biacromial breadth, chest girth, abdominal girth, cephalic index and CP3 were low or insignificant. The tendency for body size to be larger in the northeastern areas and smaller in the southwestern areas is clear. As an example, a three-dimensional plot of mean weight against latitude and longitude is shown in Fig. 3.3, which shows that the geographic variation in body size is a continuous northeast-southwest cline.
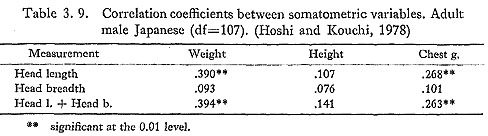
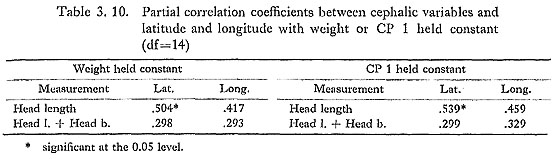
Head length and head length+head breadth are, like body size, larger in the northeastern areas and smaller in the southwestern areas. In modern Japanese, the correlation between somatic measurements and cephalic ones is generally low. Stature is not significantly correlated with head length or head length+head breadth, whereas the correlation between weight and these cephalic variables is low but significant (Table 3.9). This suggests that the cline in head length and head length+head breadth of the Nishi male series may be a secondary product of the correlation between body size and these variables. In fact, when body weight or CP1 was held constant, all the partial correlation coefficients are very low and only the correlation between head length and latitude remains significant at the 5% level (Table 3.10).
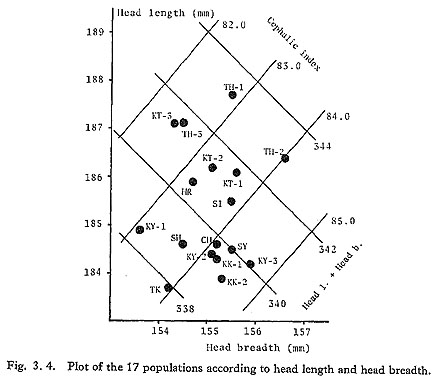
Cephalic index and CP3 do not show significant correlation with latitude or longitude. Figure 3.4 is a plot of head length against head breadth, and it shows that the disagreement between the distribution pattern of the cephalic index and those of head length and head length+head breadth is chiefly attributable to the head breadth of the Tohoku-2 population, which is large, and that of the Kyushu-1 population, which is small.
5. Summary and Conclusions
|
 1=
1=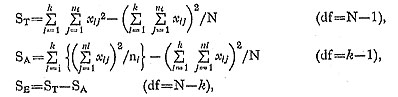
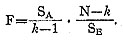
 ni is the total number of subjects, and k is the number of populations. F-value, the ratio of the inter-population variance over intra-population variance, is: