CHAPTER 2
The Nishi Series
|
At the annual meeting of the Japanese Association of Anatomists held in 1942, a National Physical Survey Commission headed by Seiho Nishi was established to investigate the average physique of the Japanese people and geographic variations thereupon (Hirakou, 1942). Thereafter, until the commission was disbanded in 1945, a nation-wide somatometric survey was carried out by the members of the departments of anatomy of a large number of universities and medical colleges all over Japan. Copies of the protocols were kept at Department of Anatomy, Faculty of Medicine, Imperial University of Tokyo (now The University of Tokyo), which housed the main office of the commission. The "Nishi series", now kept at the Department of Medicine, University Museum, The University of Tokyo, consists of these copies. The proceedings of the Commission meetings were published irregularly in Acta Anatomica Nipponica (20:329-332, 332, 520-521; 21:634; 22:202-203, 442-443; 23: 23). Eventually the number of the subjects amounted to more than 25,000, and the number of participating universities or colleges to 27 (Nishi, 1952). Means and standard deviations in measurements covering both sexes for students and the general population have already been published (Nishi, 1944a, 44b, 52), but no analysis of geographic variations has yet been attempted, for the reasons that the number of subjects was insufficient and that incomplete standardization in measuring techniques allowed fairly large errors in some measurement items (Nishi, 1952). The sex, age, occupation and origin of the subjects of the Nishi series were varied. In this study, data regarding only those subjects who satisfy the following conditions have been used:
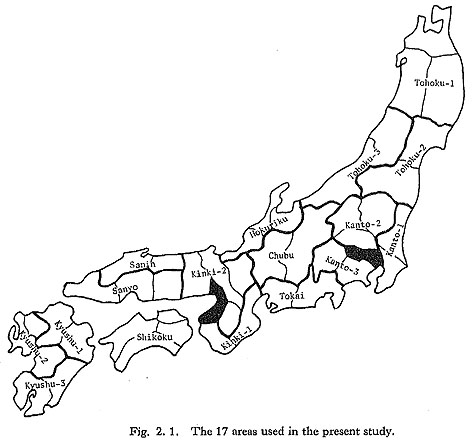
Subjects from the following islands were excluded from the present analyses; Izu Islands and Ogasawara Islands in Tokyo, Sado in Niigata Prefecture, Awaji in Hyogo Prefecture, Oki in Shimane Prefecture, Tsushima, Iki and Goto Islands in Nagasaki Prefecture, Amakusa Islands in Kumamoto Prefecture, and Nansei Islands in Kagoshima Prefecture. The number of subjects satisfying the above conditions was 3689 for males and 1199 for females. 1. Regional UnitsStudies of geographic difference have often taken prefectures as their basic regional unit. Prefectures were not used here, however, for several reasons. First, they define political rather than ecological areas, and do not necessarily coincide with the regions in which mating usually takes place; second, the number of the subjects in one prefecture is often too small for statistical analysis, especially for females; and third, a general view of the geographic variation may hardly be obtained if the inhabitants of Japan were split into more than forty groups. Consequently, Japan was divided into the following 17 regions (Fig. 2.1): Tohoku-1 (Aomori, Iwate and Akita Prefectures), Tohoku-2 (Miyagi and Fukushima Prefectures), Tohoku-3 (Yamagata and Niigata Prefectures), Kanto-1 (Ibaraki and Chiba Prefectures), Kanto-2 (Tochigi, Gunma and Saitama Prefectures), Kanto-3 (Kanagawa and Yamanashi Prefectures), Tokai (Shizuoka and Aichi Prefectures), Chubu (Nagano and Gifu Prefectures), Hokuriku (Toyama, Ishikawa and Fukui Prefectures), Kinki-1 (Mie and Wakayama Prefectures), Kinki-2 (Shiga, Kyoto, Hyogo and Nara Prefectures), Sanyo (Okayama, Hiroshima and Yamaguchi Prefectures), San'in (Tottori and Shimane Prefectures,) Shikoku (Tokushima, Kagawa, Ehime and Kochi Prefectures), Kyushu-1 (Fukuoka and Oita Prefectures), Kyushu-2 (Saga, Nagasaki and Kumamoto Prefectures), and Kyushu-3 (Miyazaki and Kagoshima Prefectures).
Tokyo Metropolis and Hokkaido and Osaka Prefectures were excluded because the influx of people into these regions has been remarkable. According to the results of the first national census, taken in 1920, the proportion of people born in other prefectures was very high in these prefectures, being 47% in Tokyo and Hokkaido and 40% in Osaka. The fact that the birthplaces of grandparents were not entered in the protocols of many subjects from Tokyo and Osaka may relate to the great population flux in these prefectures. As for Hokkaido, it is well known that the inhabitants consist of relatively recent immigrants from the main islands and their descendants. After screening for this condition, the final subjects were 3564 males and 1120 females. 2. Universities and Colleges Which Participated in the ResearchThe measurements used in this study were taken by the members of the Departments of Anatomy of the following universities and medical colleges (present name with the location in parentheses):
Male subjects:
Female subjects:
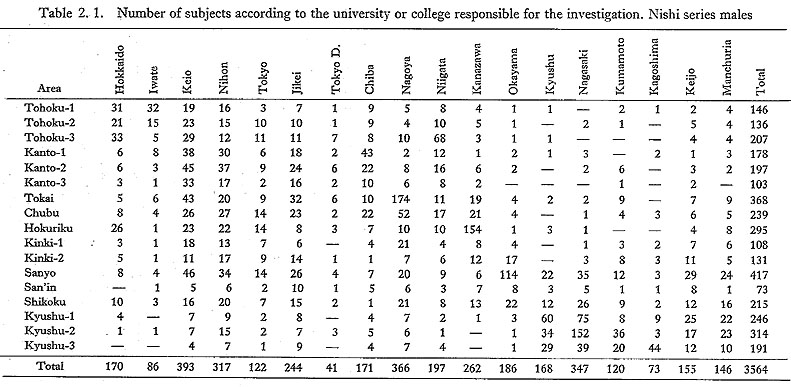
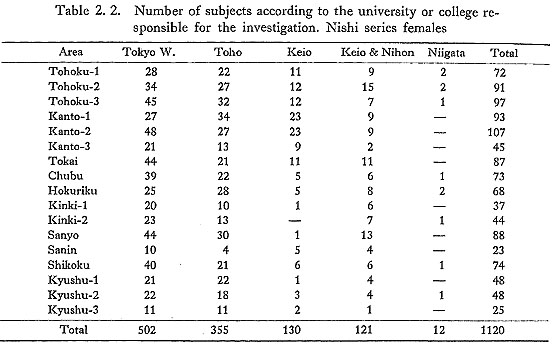
Tables 2.1 and 2.2 show the numbers of male and female subjects according to the universities or colleges responsible for the investigation, respectively. A rather great proportion of the male subjects in the Tokai area were measured by Nagoya University, in the Hokuriku area by Kanazawa University, in the Sanyo area by Okayama University, in the Kyushu-1 area by Kyushu University and Nagasaki University, and in the Kyushu-2 area by Nagasaki University. Therefore, measurements for these areas may be influenced by slight differences in measuring technique. Measurements for females seem to be less influenced by such factors, but because most of the female subjects were students at colleges or schools in Tokyo, it is possible that these subjects do not represent the inhabitants of the areas concerned as adequately as do the males.
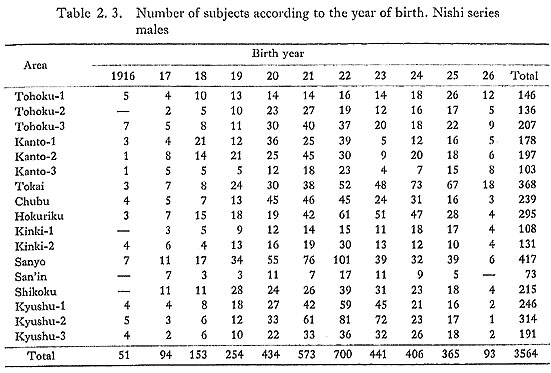
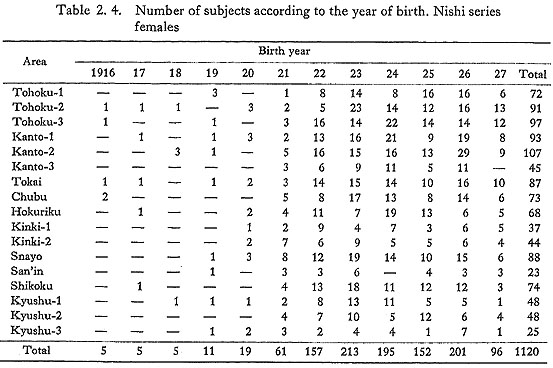
3. Birth Years of the SubjectsTables 2.3 and 2.4 show the numbers of the male and female subjects according to their years of birth. About 80% of the male subjects were born in the years between 1920 and 1925, and about 90% of the female subjects between 1922 and 1927.
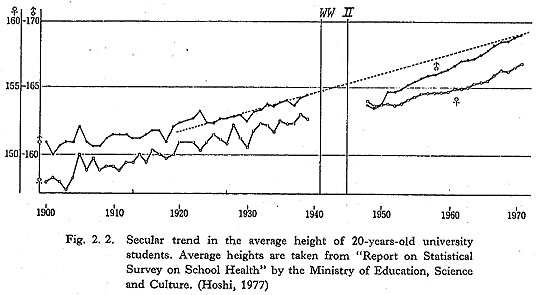
Figure 2.2, which shows the secular change in the average stature of 20-year-old university students, is based on data from "Report on Statistical Survey on School Health" issued by the Ministry of Education, Science and Culture (Hoshi, 1977). Average stature became greater gradually from the Meiji era onward, but this tendency was halted, or rather reversed, during World War II (the effects of the war were greater in males than in females). After the war, stature once again began to increase. Since reports for the 8 years around the war (1940-47) were not published, we can only estimate from Fig. 2.2 that those born in 1919 were not influenced by the war.
Shortage of food and deficient nutrition results in retardation of the adolescent growth spurt and in lower stature at the age of 20. Therefore, the point at which the effects of the war started to become manifest can be estimated from the secular change in peak height velocity age (PHV age).* PHV ages were estimated by the method of Hoshi (Hoshi and Kouchi, 1981). Figure 2.3 is a plot of PHV age based on the longitudinally collected data from "Report on Statistical Survey on School Health", against the birth year. It shows that PHV age of boys born in 1923, and that of girls born in 1925, began to increase.
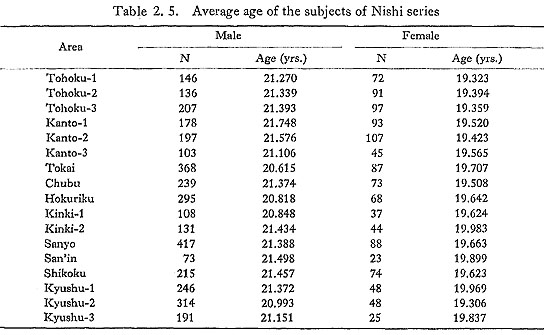
The proportion of male subjects born before 1923 is about 60% on the average, varying from 44% to 79% in different areas. The proportion of female subjects born before 1925 is also about 60% on average, varying from 47% to 77% in different areas. Consequently, it may be concluded that about 60% of all subjects were born and reared in the relatively stable pre-war period. Table 2.5 shows the number and the average age of the subjects of each area. There is no great age difference between areas.
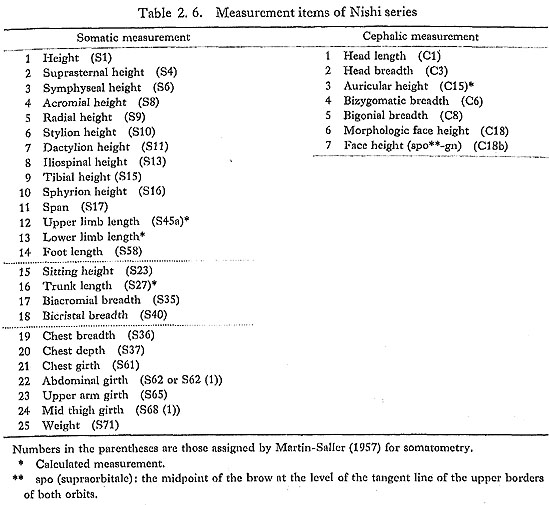
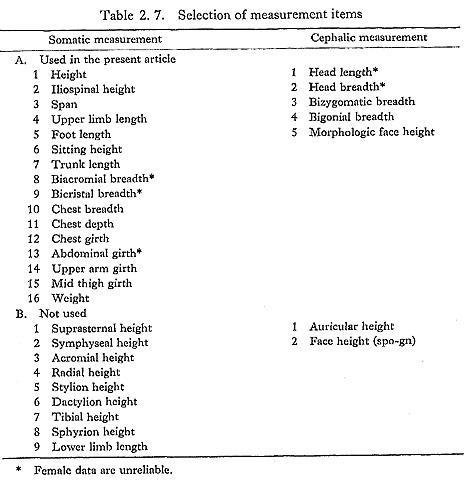
4. Measurement ItemsAs shown in Table 2.6, 25 somatic and 7 cephalic measurements were taken on each subject of the Nishi series. However, for the following reasons, not all of these maesurements were used in this analysis.
The first reason is redundancy of information. If the set of measurement items used in analysis includes many highly correlated items with similar somatological meaning, the geographic difference in the characteristics represented by these measurement items may be exaggerated in a multivariate analysis. In a univariate analysis it may lead to mere repetition of the same analysis. The second reason is measurement error. As already pointed out by Nishi (1952) difficulty in the standardization of measuring technique can lead to large measurement errors. When such erroneous measurements are used for the analysis, differences in measuring technique may be more apparent than real differences. In fact, systematic measurement error influences the results of both univariate and multivariate analyses (Spielman et al., 1972; Jamison and Zegura, 1974; Kouchi and Hanihara, 1981). Inter-population comparison may be greatly influenced by inter-observer systematic error. The subjects of the Nishi series were measured by different observers, and the data then reclassified according to the place of birth, so that it is impossible to estimate the magnitude of inter-observer error. In such a situation, a practical way to minimize the influence of measurement error is to exclude measurement items with a great inter-observer error or great inter-observer variance compared with between-individual variance. The measurement items used in this study were selected after reference to the results of Spielman et al. (1972), Kemper and Pieters (1972), Jamison and Zegura (1974) and Kouchi and Hanihara (1981). The results of Herskovits (1930), Davenport et al (1934) Gavan (1950), Hirata (1950), Watanabe (1957), Nakao et al. (1972), Ikeda and Terada (1977) and Tarumi (1980) were also consulted. As a rule measurement items whose magnitude of measurement error was unknown were excluded from the present analysis. However, when the information carried by the measurement item was unique, it was used for univariate analysis even though its magnitude of error was great or unknown. Measurement items were also selected for the information they carried. This selection was carried out using principal component analyses of correlation matrices between measurement items (Kouchi, 1977, 79, 80). A. Somatic MeasurementsThe only redundancy of information in the measurements used in this study concerns the lengths of the long bones of the limbs. Consequently, 6 measurement items for calculating other measurement items were excluded (suprasternal height, symphyseal height, acromial height, radial height, stylion height, and dactylion height). Since both ihospinal height and lower limb length represent the length of the lower limb, lower limb length was excluded because it was a calculated, or indirect, measurement. Among the remaining 18 measurement items, only height (stature), weight and foot length have small measurement errors. The remaining 15 measurement items were divided into four groups as follows, according to the magnitude of the measurement error: (a) measurement items with great error: tibial height and sphylion height; (b) measurement items with rather great error but unique information: iliospinal height biacromial breadth, bicristal breadth, chest breadth, chest depth, and upper arm girth; (c) measurement items with unknown magnitude of error: trunk length and midthigh girth; (d) measurement items with rather small error: span, upper limb length (calculated), sitting height, chest girth, and abdominal girth. Among the measurement items mentioned above, tibial height and sphylion height were excluded, but trunk length and mid-thigh girth were used for univariate analysis. There are many female subjects with biacromial breadth values too small and bicristal breadth values too large to be reliable. For abdominal girth, some observers took waist girth (S62) and others took abdominal girth (S62 (1)). The difference between these two measurements can be neglected in males (Hoshi and Kouchi, 1978), but is significantly large in females (Hoshi et al., 1981), Consequently, abdominal girth, biacromial breadth and bicristal breadth are all unreliable for females) and thus were not used. Information concerning the development of muscle highly correlated with calf and forearm girths, robustness of the long bones of the limbs and mass of subcutaneous fat cannot be provided by the measurement items which were used in the present analyses. B. Cephalic MeasurementsThe only redundancy of information in the cephalic measurements is related to the height of the face: face height (spo-gn) has practically the same information as morphologic face height. Face height (spo-gn) was excluded because the definition of the landmark, supraorbitale, was ambiguous (Nishi, 1944a, 52) arid because some observers gave extraordinarily large values. The remaining 6 measurement items were divided into three groups as follows, according to the magnitude of error: (a) measurement items with great error: auricular height; (b) measurement items with small error: head length, head breadth and bizygo-matic breadth; (c) measurement items with great error but unique information: morphologic face height and bigonial breadth. Auricular height was excluded because both the direct measuring method and the calculating method were adopted, and because its inter-observer error was too great to allow it to be considered a geographic difference (Nishi, 1952). Also, an investigation of the modern human crania suggested that auricular height is not so important for a study of inter-population relationship of modern man (Hanihara, 1979). Though head length and head breadth have small measurement errors, many of the female subjects have extraordinarily small values for head length and head breadth, so that these measurements of the female subjects are unreliable. Head length less than 160 mm and head breadth less than 140 mm in the female data were eliminated here. The information concerning the head and the face is very limited. The measurement items taken and selected are only those which represent the gross dimensions of the head and the face, and do not carry information concerning interesting characteristics such as facial flatness. The results of the selection of measurement items are summarized in Table 2.7.
C. IndicesThe following 8 indices were selected from those frequently used (Table 2.8):
Among the above indices, morphologic facial index and morphologic face height+bizygomatic breadth of both sexes and cephalic index of females are unreliable because of measurement error. |


|
1)* PHV age is highly correlated with skeletal age. Together with menarcheal age in the case of females, it is considered to be a good measure of physiological age (Ashizawa et al., 1981).[return to the text] |