PART I. SEASONAL DATING METHOD
V. Shell Growth and Growth-Line Analysis
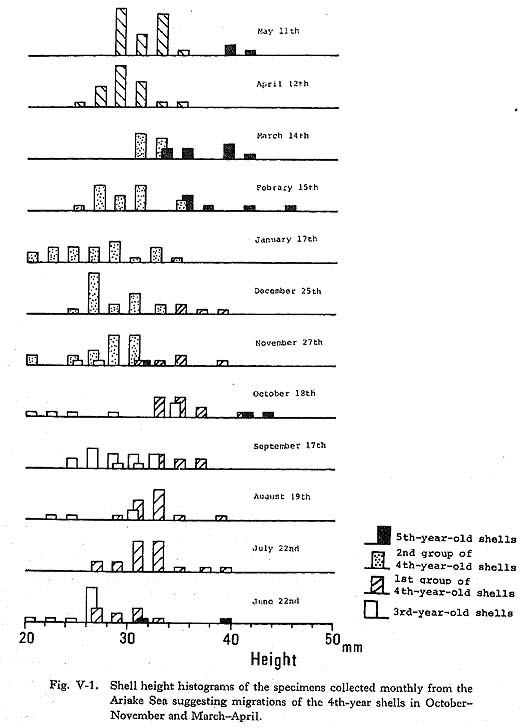
V-1. Life History of Meretrix lusoriaIn this section, the shell growth through the life history of this species is described using data from fisheries science, and compared with the data obtained by growth line analysis. The spawning seasons of M. lusoria have been well studied in order to cultivate young shells: from June to October in Tokyo Bay (Taki, 1947) and in June and again from. September to October in the Ariake Sea (Fishery Station of Kumamoto Prefecture, 1951). The development and growth of a closely related form to M. lusoria in Korea was examined by Yoshida (1941). The trochophore stage of the larvae, which is then about 120 µm long, can be observed 24 hours after fertilization. The veliger stage of free swimming larva continues for 3 weeks (0.20 × 0.18 mm in size). Then the larvae enters benthonic life as a juvenile shell. At the same time, the larva of M. lusoria, which has a transparent "first prodissochonch" composed of calcium phosphate, begins to secrete at the mantle the opaque "second prodissochonch" composed of calcium carbonate (Watabe, 1956). Therefore, the outer shell layer cannot be observed until the juvenile shell produces this opaque shell deposition when it starts benthonic life at 3 weeks after fertilization. According to Yoshida (1941), the new young shells of Meretrix meretrix in 1939 appeared beginning in late July. The shells metamorphosed in the late autumn but did not grow until the next spring. Therefore, small shells of 1-3 mm in shell length found in spring were not the spawns of that year but those of the previous autumn. Clams M. lusoria have a peculiar habit of migration. Young clams of 30-60 mm in length move from their habitat near the high water neap toward the low water neap from early summer to autumn (Kishinoue, 1913; Uchida, 1941). Migration of the clam is also apparent in the shell height histograms (Fig. V-1) of the monthly-collected specimens from the fixed location of tidal flat in the Ariake Sea, Constant increases in shell height were observed from April to October and from November to March of the next year, with gaps between October and November and between March and May, suggesting two migrations at those times.
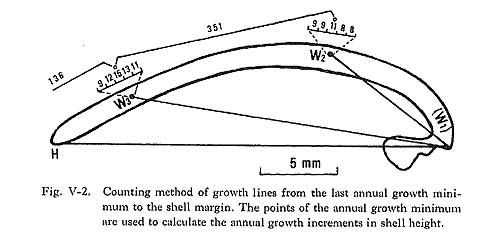
Hamai (1935), in his comprehensive work on the shell growth of this species, indicated geographical variations in the rate of shell growth. The optimum annual mean temperature for shell growth was about 20°C, and clams from the Seto District showed the most rapid growth. On the other hand, not only northern specimens but also southern specimens showed slower growth, an effect of the high summer temperature. Growth line analysis will enable estimation of successive shell growth by age in each specimen, and the results will be discussed in the following chapter. It has already been noted that the growth minimum in the annual pattern is suitable for a standard date point of one year. Measurement of the thickness of the daily growth increment is so time-consuming that a more convenient method, using the greatest density of growth lines, was adopted. As illustrated in Fig. V-2, the point of the annual growth minimum was set at the center of the interval of maximum density determined by counting the growth lines along 0.2 mm intervals near the winter bands (Koike, 1972). The collection date was estimated by counting the number of growth lines from the point of annual growth minimum to the shell margin.
The deviation of the estimated collection date from the actual collection date was determined using the monthly collected specimens from the Ariake Sea (Fig. V-3). The mean date of the annual growth minimum for all specimens corresponded to the 14th of February. Each histogram of the deviation of the counting dates from the mean date of the 12 monthly groups showed that there was no marked skew in the distribution and the standard deviation was ±17.6 days. Deviations of each monthly group from the mean of the total counts are between +8.2 and -9.4 days. There was no clear trend in the means of each monthly group, e.g., increasing with counts. Based on these data, the growth minimum corresponds to the middle of February, and its individual deviation is within 18 days.
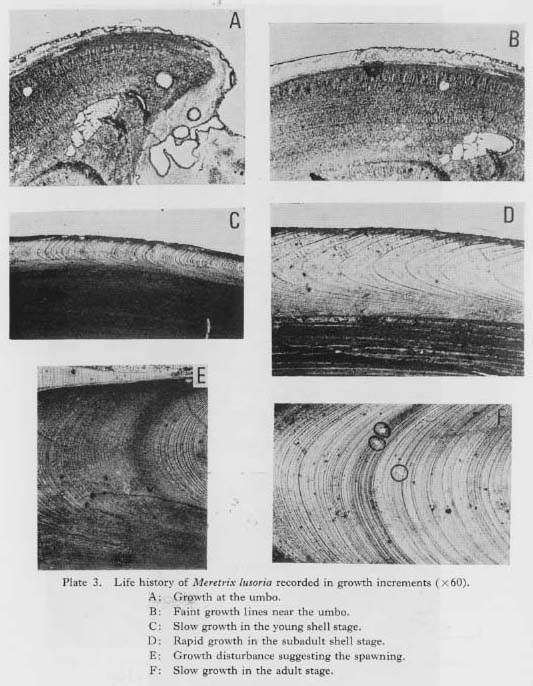
V-3. Growth Stage and Growth Curve of Meretrix lusoria Shells Examined by Growth-Line AnalysisIn the photomicrograph of a cross-section near the umbo (Plate 3-A), the area up to 200 µm from the umbo is not accompanied by the outer layer. As mentioned in Chapter V-1, shell formation with calcium carbonate is begun after the larva of 0.2 mm in size starts benthonic life. The early outer layer is so homogeneous that growth lines are difficult to observe. When the shell exceeds 1 mm or more in height, faint growth lines appear in the outer layer (Plate 3-B), and growth line analysis can start at this point.
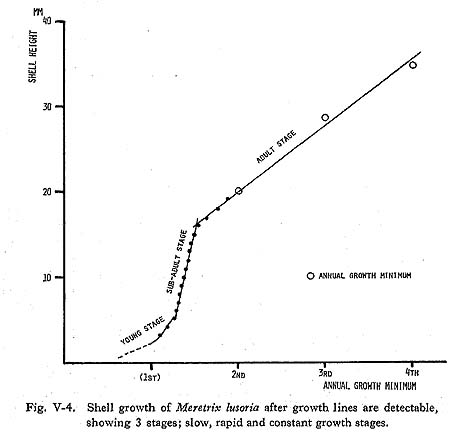
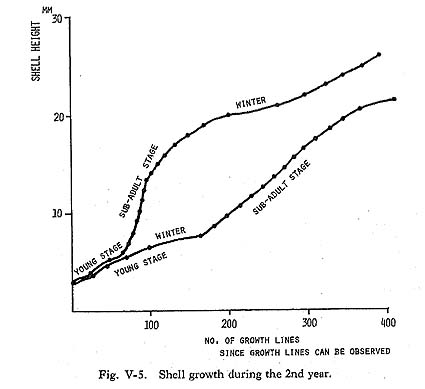
The shell growth of M. lusoria seems to be divided into 3 stages: slow, rapid and constant growth stages (Fig. V-4). Shell growth in young shells is thought to be very slow (Yoshida, 1941). Especially, clams spawned in autumn hardly grew during the year, and shells of about 1 mm in length were detectable in the following July, growing to 5 mm in August. Growth lines in this stage unfortunately are difficult to observe because the outer layer within 3-5 mm from the umbo point is usually eroded in the older shells. Therefore, in cases in which the outer layers of the early growth stage were not preserved, and the first annual growth minimum detected by growth line analysis was over 5 mm in shell height, it is estimated that this was the 2nd winter band. Shell growth in the vicinity of 5 mm from the umbo point was not rapid (Plate 3-C), then growth gradually accelerated and attained the rapid growth stage at about 10mm in shell height (Fig. V-5). Shell growth in this stage is the most rapid in the life history of the clam, and daily growth increments of 200-350 µm are recorded in the summer growth of the early stage (Plate 3-D). After the stage of maximum growth, the rate of shell growth shows a decrease with age.
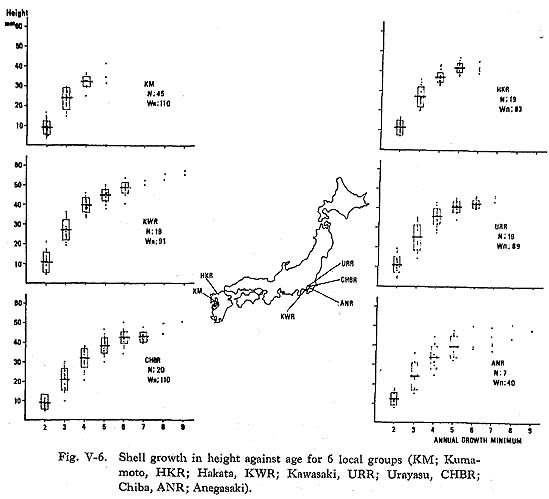
In adult shells, the width of the daily shell growth increment becomes very narrow and relatively constant (Plate 3-E). Occasionally, disturbance bands suggesting spawning are seen in the summer growth increment of 6th-year or older shells (Plate 3-F). Shell growth rate and its variations were examined using recent specimens collected by Suzuld (1935) from 5 localities, and 1 group of specimens collected by the author. These specimens consisted of 2 groups from the coast of Kyushu (HKR and KM groups) and 4 groups from Tokyo Bay (KWR, URR, CHBR and ANR groups), as illustrated in Fig. V-6. The yearly shell growth was examined with the shell height af the annual growth minimum (Fig. V-2). The locations of the umbo point and the point of the annual growth minimum (Wn) on the replica film were measured with a vernier scale on the stage of a microscope, and the distance between the umbo and each point of the annual growth minimum was used for the shell height at the annual growth minimum (Hwn).
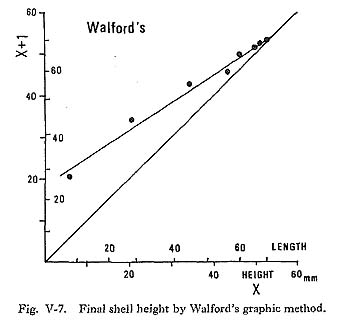
Shell height at the annual growth minimum had wide individual variations for each local group (Fig. V-6): The standard deviations were 3.0mm to 5.3 mm, 5.2mm to 6.5 mm, 2.2 mm to 6.4 mm and 2.3 mm to 5.9 mm at the 2nd, 3rd, 4th and 5th annual growth minima, respectively. The average shell height varied considerably among groups. For example, there is a deviation of 7.7 mm in shell height at the 3rd mid-winter between the rapid growth groups (HKR and KWR groups) and the relatively slow group (CHBR group). The variation among groups tended to decrease from the 4th year on. For the mathematical treatment of the growth curve, Bertalanffy's growth formula (1938) is widely used in fishery studies. The differences between the actual lengths at given ages and the final length estimate with this formula, when plotted in natural logarithms against age, must give a straight line. In 1946, Walford demonstrated a new graphic method based on the exponential growth formula to obtain the final length (Fig. V-7).
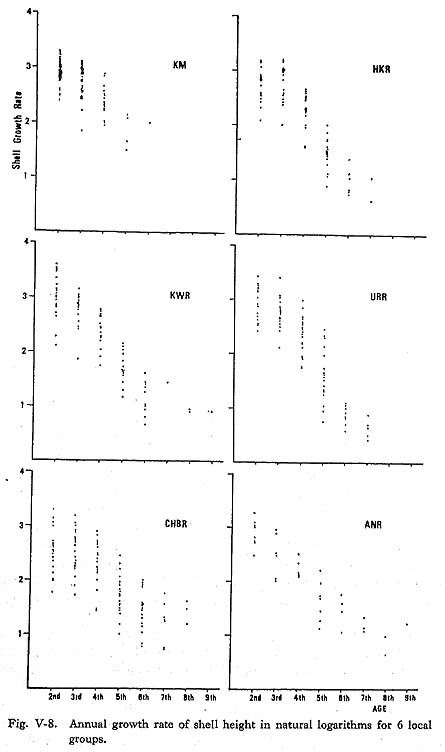
However, it was difficult to obtain final length estimates due to the shortage of data for aged specimens. In the present research, the growth rate modified from Bertalanffy's growth formula was used for the study of shell growth variation: the annual increase was represented by the differences in the successive shell heights at the annual growth minimum (Hwn-Hwn-1). If the annual increase (Hwn-Hwn-1) is exponential, the logarithmic annual growth increase [ln(Hwn-Hwn-1)] plotted against the shell age will generally be a straight line. The regression line for logarithmic annual growth increases against the shell age or growth rate was used in comparisons among local groups to observe the shell growth variations in detail. The natural logarithms of the annual increase [ln(Hwn-Hwn-1)] (Fig. V-8) indicated that the annual increase between the 2nd and 3rd annual growth minima was generally the greatest through the life of the shell. The correlation coefficients between annual increase and age are rather low, ranging between 0.87 (URR group) and 0.62 (HKR group). The regression coefficients, or gradient of the regression, also showed wide variations among groups, ranging from 2.8 (CHBR group) to 3.3 (URR group). Gen-erally, groups with relatively rapid growth had large regression coefficients, while groups with slow shell growth had small ones.
V-4. ConclusionsThe method of growth line counting for estimating the collection date and the range of its application in the life history and geographical variations of M. lusoria were studied in this chapter. The mean date of the annual growth minimum of the clams of the 12 monthly groups from the Ariake Sea corresponded to the middle of February, when the annual minima in the sea-water temperature were usually recorded. Therefore, the date of the standard period of the year will be set at the 14th of February. Although the histogram of growth line counts usually shows a marked skew to counts lower than expected (Pannella, 1974; Farrow, 1972), the present data show no skew, suggesting that there will be no systematic error in the count due to missing lines. The deviations in counts are thought to be due mainly to individual variations in the density of lines at the growth minimum. In other words, the deviations seem to be due to individual variations in response to the minimum temperature. Moreover, study of recent shells from 6 local groups inevitably showed distinctive growth de-crease in the winter, making the seasonal dating method by growth line counts applicable even across prehistoric environments, with a counting error of ±18 days in estimating the date of collection. Growth line counting for estimating the collection date of the clam will be restricted during the period when clear growth lines are formed in rhythmic periodicity. In the life history of this species, early shell growth is difficult to observe due to the bad pres-ervation of the outer layer during this period, while stunted growth suggesting spawning 01 other disturbances was frequently noted in the aged shell growth of the late adult stage, making the estimation of collection dates unreliable. Hall (1974, 1975) also reported that the average number of growth increments between the annual bands on Callista chione decreased as the shell grew older, showing an increase of biocheck with age. Investigation of local variation in shell growth showed that a growth formula suing natural logarithms is adequate for observing details of shell growth pattern: clams with a high growth rate at a younger age had a tendency to decrease in growth rate later on, while those with an early low growth rate experienced a slow increase, approaching normal shell length later. The former pattern seems to correspond with the southern specimens, and the latter with the northern specimens. These results agree well with those obtained by Hamai (1935) in the research of the growth curve of M. lusoria. |