4. TOOTH CROWN MEASUREMENTS
4.5. Distance Analysis
4.5.1. Mahalanobis' Generalized Distance Based on the Mesiodistal Crown Diameters in the Permanent DentitionIn this section, biological distance between Aborigines and certain other populations is analysed in terms of Mahalanobis' generalized distance, D2, based on the mesiodistal crown diameters. The generalized distances were computed only for the permanent dentition, both male and female groups. In computing distances, some additional populations reported by several previous authors were included. However, since no variance-covariance matrix for these addi-tional populations has been given, a pooled dispersion matrices obtained from the populations studied by the author were used. The populations newly included here are Aleuts (Moorrees, 1957), Javanese (Mijsberg, 1931), Norwegian Lapps (Selmer-Olsen, 1949), Swedes (Seipel, 1946), Tristanites (Thomson, 1955) and North American Whites (Moorrees et al., 1957). Figures 2 and 3 illustrate generalized distances between Aborigines and other populations in the male and female groups, respectively. Although there are some discrepancies in the order of populations, being arranged in increasing order of distances, between males and females, they share some other characteristics in common. The remarkable point is that the distance between Aborigines and American Negroes is very small both in males and females. Similar to this, Pimas are the closest to Aborigines in females, and relatively close in males. This might be caused by relatively large size of the teeth in the three populations. Another remarkable point is that the Caucasian populations which represent the smallest teeth are not necessarily most far from Aborigines. This seems to be related to more or less extent of similarities in the relative size of teeth, or tooth groups, among these populations. Further, it is of quite interest to note that Aborigines are most far from the northern people such as Aleuts, Ainu and Norwegian Lapps. The results appear to show dissimilarities in relative tooth size rather than in absolute size of teeth.
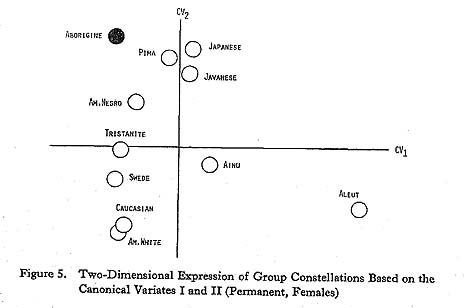
In order to recognize relative locations of each population which is scattered in a multi-dimensional space, two-dimensional scattergrams were drawn on the basis of the first and second canonical variates which were computed by Rao's method (1952). Figures 4 and 5 are scattergrams for males and females, respectively. In Figure 4 clustering is hardly possible since each population is scattered separately. However, if we pay attention to the first canonical variates (CV1 axis), it is evident that the populations presented here might be grouped into four clusters-Aleut-Ainu cluster, Pima-Javanese-Japanese-Lapp cluster, American Negro-Aborigine cluster, and Swede-Caucasian-Tristanite-American White cluster.
In the same manner, females (Figure 5) could be grouped into three clusters-Aborigine-American Negro-Tristanite-Swede-Caucasian-American White cluster, Pima-Japanese-Javanese-Ainu cluster, and Aleut cluster.
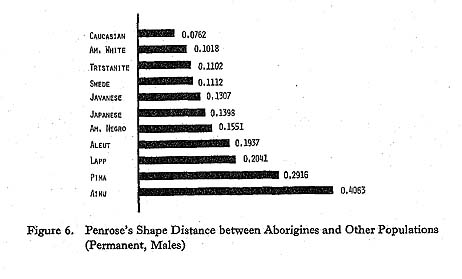
In both cases, Aborigines are located closer to American Negroes and Pimas and far from the northern peoples. Japanese and Caucasian populations are intermediate in distance from Aborigines. 4.5.2. Penrose's Shape Distance Based on the Mesiodistal Crown Diameters of the Permanent and Deciduous DentitionsThere has been some criticism of similarity coefficients which represent the so-called biological distance. For instance, Corruccini (1973) stated that "only size differences were detected by the C.R.L., Penrose's size distance, D2, and canonical variates, and as a result these methods failed to produce an accurate classification," and further goes to state that "Penrose's shape distance and Q-mode correlation coefficients produced better results due to their determination of similarity on the basis of more important shape and morphological differences." Although there might be some argument against such a recognition, it is of great importance to compare populations in terms of shape component. Sokal and Sneath (1963) strongly recommended the use of Q-mode correlation coefficients to obtain taxonomically more important informations, but the author employed Penrose's shape distance simply because the computer program was easily available. Figures 6 and 7 illustrate shape distance between Aborigines and other populations on the basis of mesiodistal crown diameters in the male and female permanent denti-tions, respectively. The pooled standard deviations were calculated from standard deviations given for each population. It is quite evident from Figure 6 that, in the male permanent dentition, Aborigines are most close to Caucasian populations and most far from the northern popula-tions such as Aleuts, Lapps and Ainu; and Javanese, Japanese and American Negroes being in between. It is of interest to note that the large difference between Aborigines and northern populations is recognized in generalized distance and shape distance in common (see Figure 2). In contrast to this, Caucasian populations which are located relatively far from Aborigines in generalized distance come close to the latter in shape distance.
Almost the same trends can be seen in the female permanent dentition in more typical fashion than in the male dentition. In Figure 7, at least four groups may be classified by the order from the smallest to the largest shape distance: American White wede-Caucasian group, American Negro-Tristanite group, Pima-Javanese-Japanese group, and Aleut-Ainu-Lapp group. This trend seems to be quite suggestive for analysis of population affinity of the Aboriginal dentition.
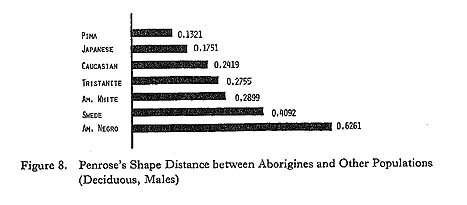
As to the comparison between Mahalanobis' generalized distance and Penrose's shape distance, there is naturally a certain extent of difference caused by the difference between the two methods. There are, however, some common features in the results obtained by both methods. In order to recognize overall relationship between the two kinds of distances, correla-tion coefficients were calculated from the distance coefficients for the male and female permanent dentitions (see Figures 2-3 and 6-7). Correlation coefficients for males, 0.40 with 9 degrees of freedom, and those for females, 0.59 with 9 degrees of freedom, are both insignificant under the 5% level. These results show that the overall relation-ships between the two sets of distance coefficients under consideration can be regarded as independent of each other. There are, nevertheless, remarkable similarities between the two sets of distances both in male and female permanent dentitions. If we compare Figure 2 with Figure 6 and Figure 3 with Figure 7, it becomes quite evident that the northern populations-Aleuts, Ainu and Norwegian Lapps-are most far from Aborigines either in generalized distance or in shape distance. These results likely show that the northern populations are quite different from Aborigines in both size and shape of the permanent dentition. In regard to the other populations, such a similarity between the two sets of distances can be hardly pointed out since the order of similarities to Aborigines varies to a larger extent. In contrast to the permanent dentition, the deciduous dentition represents somewhat different trends. This seems to be partly caused by the difference in the number of populations compared. Nevertheless, the order of similarities to Aborigines are largely different from that of the permanent dentition. In Figures 8 and 9, it is commonly seen that the Mongoloid populations are the closest to Aborigines, and Swedes and American Negroes are farthest from the latter.
In his factor analysis study of the deciduous dentition, Hanihara (1974) charac-terized Aboriginal and Japanese deciduous dentitions as 'molar type' in which the back teeth were comparatively larger, and Caucasians and Pimas as 'incisor type' where the front teeth were relatively larger. According to the same author (1976), on the other hand, the permanent dentition of Aborigines and Caucasians is 'molar type' and that of Japanese is 'incisor-canine type'. These results apparently show that the 'shape' of the teeth probably differs between the deciduous and permanent dentitions even in the same population. The discrepancies in shape distance between both dentitions may stem from difference in shape com-ponent between the two dentitions. At all events, the shape distance of the deciduous dentition shows that Pimas and Caucasians are relatively close to Aborigines, Swedes and American Negroes far from the latter, and the order of similarity of the remaining populations varies between males and females. |