4. TOOTH CROWN MEASUREMENTS
4.4. Principal Component Analysis
4.4.1. Principal Component Analysis of the Mesiodistal Crown DiametersBefore we enter into comparison of tooth size among different populations on the basis of biological distance, it is of importance to summarize the mesiodistal crown diameters into a small number of new variables that are called principal components, and to compare the populations in terms of these variables. Hanihara (1974, 1976) carried out factor analysis on the mesiodistal crown diameters of the deciduous dentition, and principal component analysis on those of the permanent dentition. In regard to the deciduous dentition, he found that the first factor was related to general size of the tooth crown so that this factor was referred to as size factor; the second was a shape factor which contrasts the size of front teeth with the back teeth; and the third was a factor mainly related to the crown size of the deciduous canines. The rates of contribution of these three factors are about 75% in Japanese and 82% in Aborigines. Next to this, the author computed factor scores based on the factor loadings and summarized deciduous dentition in some different populations as follows: the deciduous dentition of Japanese may be characterized by medium general size, relatively large back teeth compared with the front teeth, and smaller canines; those of Caucasians by smaller general size, relatively smaller molars and moderate size of canines; those of Pimas by medium to larger general size, larger size of incisors and canines; and Aborigines by larger general size, particularly larger size of molars and moderate size of canines in proportion. On the other hand, applying principal component analysis to mesiodistal crown diameters of the permanent dentition, Hanihara concluded that the first component relates to the size of the premolars, both maxillary and mandibular; the second to that of the maxillary lateral incisor which shows somewhat different behavior from the other three incisors; the third to the maxillary and mandibular molar size; the fourth to the size of the maxillary and mandibular canines; and the fifth to the size of the maxillary central incisor and the two mandibular incisors. In regard to these findings, Lombardi (1975) found almost the same components on the basis of 66 Mexican skulls, although proportions of the total variance in each component were somewhat different from those found by Hanihara. As in the study on deciduous dentition, Hanihara went further to compute factor scores using rotated factor loadings, and compared mean factor scores in each popula tion studied. The results were summarized as follows: Aborigines are one of the groups with the largest overall tooth size, but their premolars and canines are relatively small and the molars are very large in comparison with the other teeth; Japanese are intermediate in general tooth size but the canines are relatively large; the Ainu dentition belongs to the group with the smallest overall tooth size among the six populations compared, especially the maxillary lateral incisor and the canines being small but the molars relatively large; Caucasians are very small in premolar, molar and incisor size but the maxillary lateral incisor and canines are a little bit larger; Pima Indians, in general, show the largest tooth size, particularly the size of the canines being the largest among the populations under consideration; and the American Negroes again show larger overall tooth size but the maxillary lateral incisor and the canines are somewhat smaller in a relative sense. As cited above, comparison of populations using factor scores is useful because they clearly show relative quantities of main factors which largely control the size of dentition. Using this method, the size and shape of the dentition may be more clearly represented than in direct comparison of size of each tooth. In the papers cited above, Hanihara analysed deciduous and permanent dentitions separately since the data of both dentitions were taken from different individuals in most of the populations compared. However, part of the dental casts of deciduous and permanent dentition from the Aborigines were derived from the same individuals who had been studied continuously for a considerably long time. Of 116 male and 104 female Aborigines, 54 and 32 individuals provide dental casts of deciduous and permanent dentitions, if not the full set of the teeth. Using mesiodistal crown diameters from these individuals, a correlation matrix which covers both deciduous and permanent dentitions was computed. In this procedure the correlation matrices were computed for males and females separately and then they were pooled together, since the numbers of individuals were small if males and females were treated separately. The purpose of this analysis is to extract principal components from a multidimensional space which is common to the deciduous and permanent dentitions, and to compare the populations in terms of principal components of dental measurements. Table 20 gives the pooled correlation matrix for mesiodistal crown diameters of deciduous and permanent dentitions, with the exception of the maxillary and mandibular third molars. The first ten eigenvalues computed from the above matrix as well as their cumulative proportions of total variance are shown in Table 21.
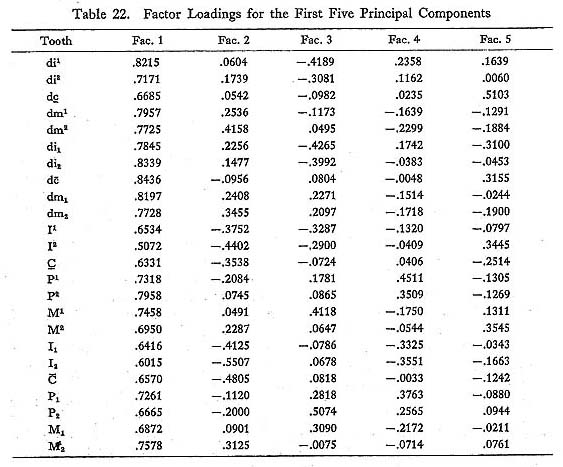
It is evident from the table that the first five eigenvalues amount to 1.0 or more so that the first five principal components may be significant, and their cumulative proportion of the total variance is 76.46%. For the next step of the analysis, we should interpret each component through factor loadings which represent correlation coefficients between principal components and original variables. Based on the correlation matrix, factor loadings have been obtained as shown in Table 22. All the factor loadings for the first component show positive values, ranging from 0.5072 to 0.8436, so that this component appears to be related to overall size of dentition including deciduous and permanent teeth. This means that whenever the tooth or teeth become larger the value of the first principal component also becomes larger, and vice versa.
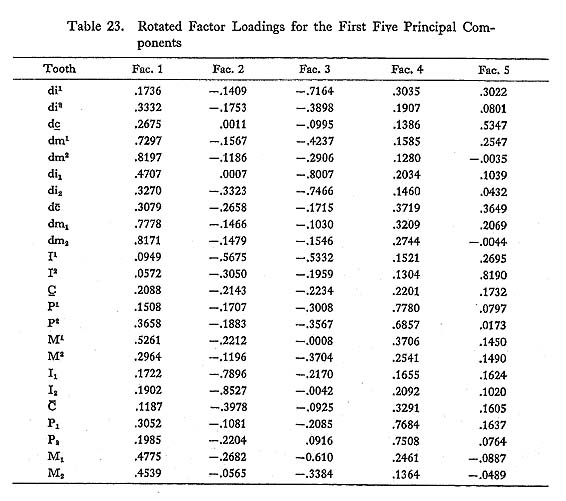
In regard to the second through the fifth components, the factor loadings take either plus or minus signs. This fact clearly shows that these components are, to a more or less extent, related to the shape component of dental measurements and contrast the size of certain teeth with that of the other teeth. However, the absolute values of the factor loadings are generally much smaller than those for the first principal components, so that the interpretation is not easy. Attending to the factor loadings showing the value of 0.4 or over, those for dm2, I2, I1, I2 and In regard to the third principal component, factor loadings for di1 and di1 show the values greater than 0.4 with minus signs, and those for M1 and P2 with plus signs. The fourth principal component correlates only with P1, and the fifth only with dc. As a result, interpretation of each principal component is quite difficult except for the first component, because absolute values of factor loadings are generally small and weighting for each tooth does not vary in a regular way. In order to make interpretations more easy, the varimax rotation method was applied on the original matrix of factor loadings (Table 23). As easily seen, it is evident that the interpretation after rotation is much easier than that before rotation.
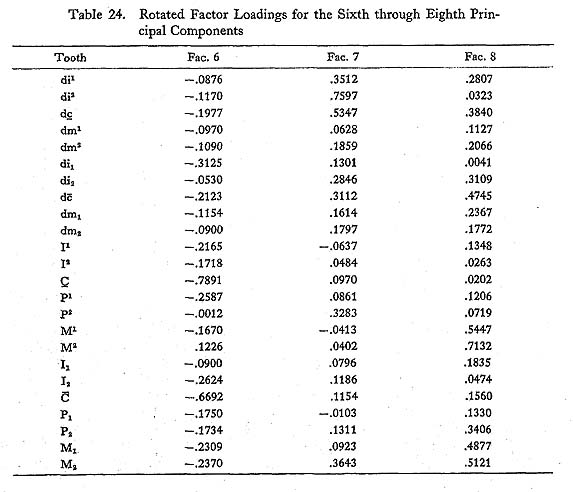
The first principal component is highly correlated with the size of dm1, dm2, dm1 and dm2, so that it seems to relate to the size of the deciduous maxillary and mandibular molars. The second component relates with I1 and I2, and a little less with I1, showing clearly that this component represents size of the permanent maxillary and mandibular incisors with the exception of the maxillary second incisor which shows somewhat different behavior from the remaining incisors. The third component represents size of di1, di1 and di2; accordingly it highly correlates with the deciduous incisors except for the deciduous maxillary second incisor. The fourth component shows high correlation with size of P1, P1 and P2, and a little less with P2. The results appear to mean that this component closely relates to the permanent premolars, both maxillary and mandibular. Finally, the fifth component correlates only with the permanent maxillary lateral incisor. As already described, the five principal components above mentioned have variances which equal or exceed 1.0 and explain 76.46% of total variance in combination. However, they do not represent all the teeth under consideration. This means that the other teeth may be related to the sixth or later principal components. Although these components are statistically less significant, it is of interest to analyse what they mean. According to the rotated factor loadings shown in Table 24, the sixth principa component highly correlates with the permanent maxillary canine and a little less with the permanent mandibular canine; the seventh with the deciduous maxillary lateral incisor; and the eighth with the permanent maxillary second molar and with the other permanent molars in less degree. Thus all the teeth under consideration, except for the deciduous canines, may be summarized into the eight principal components as tabulated in Table 24.
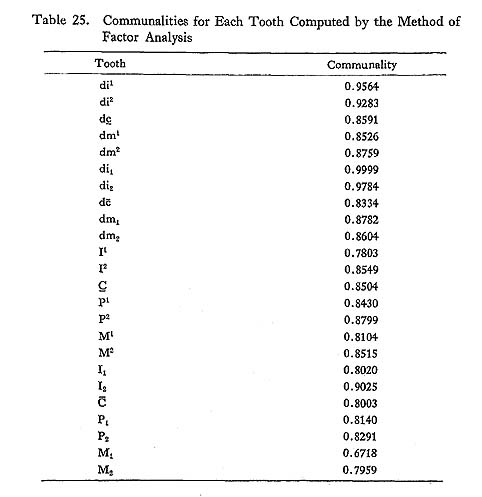
Among these components, it is of particular interest to note that the deciduous maxillary lateral incisor is closely related to the seventh component. Although this tooth does not show a large variability such as that shown by the permanent maxillary lateral incisor, the result seems to mean that this particular tooth has a variance which is more or less independent of those of the other teeth. More detailed studies on this problem should be done in relation to reduction of the human dentition. It should be also noted here that the principal components with larger eigenvalues, or variances, are not related to the permanent molars and canines which are generally regarded as the teeth showing larger variances than the other teeth. This fact might be resulted from the statistical procedures in which the analysis started from the correlation matrix, or the variance-covariance matrix, based on the standardized data with the mean of 0.0 and the variance of 1.0. This procedure does not represent the absolute size of variances but their relative size. Accordingly, the principal components are extracted in order from those having relatively larger variances regardless of size of the original means and variances. Secondly, it is noteworthy that the principal components for the deciduous and permanent teeth have been extracted separately. For the fast impression of the present author, it was supposed that each group of the deciduous teeth-incisor group, canine group and molar group-might have been combined into respective components together with the corresponding groups of the permanent dentition. The results such as those mentioned above are, however, opposed to this supposition, and suggest that the deciduous and permanent dentitions might be controlled by somewhat different factors. Thirdly, the order of the principal components ranked by means of eigenvalues may be of another interest. The teeth which are largely related with the principal com-ponents are, in descending order, the deciduous molars, permanent incisors, deciduous incisors, permanent premolars, permanent maxillary lateral incisors, permanent canines, deciduous maxillary lateral incisors, and permanent molars. This order corresponds to the order of contribution rates of each variance to the total variance in a relative sense. For instance, the first principal component which largely represents size of the deciduous molars has the largest variance among all the components if the deciduous and permanent dentition are taken into account in com-bination. Based on this fact, it is of interest to note that, among the five significant principal components, three of these represent the size of incisors, both the permanent and the deciduous. This fact suggests that, at least in the dentition of Aborigines, the incisors have relatively larger variability than the other teeth. This is also proved by the original factor loadings before rotation (see Table 22), in which the second and third principal components have, in absolute values, relatively larger factor loadings for the permanent and deciduous incisors. Finally, it may be useful to check the communalities for recognizing dependency of each tooth using techniques of factor analysis. As can be seen in Table 25, the teeth with larger values of communalities (those more than 0.9) are the deciduous incisors and the permanent mandibular lateral incisor, and those with smaller communalities (those less than 0.8) are the permanent maxillary central incisor and the mandibular first and second molars.
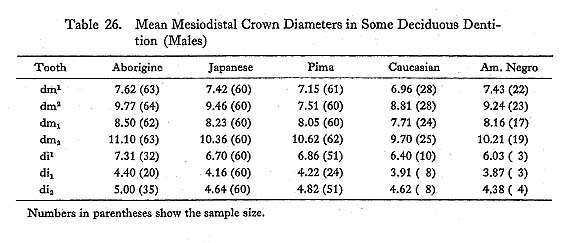
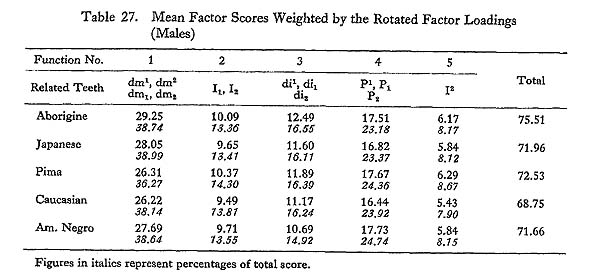
This means that the size of the former group of teeth are largely dependent on that of the other teeth, and the size of the latter teeth has a more extent of uniqueness than the other. 4.4.2. Comparison of Populations in Terms of Principal Components of the Mesiodistal Crown DiametersBased on the principal component analysis mentioned above, characteristics of tooth crown measurements in different populations may be compared by means of scores calculated from tooth size which was weighted by corresponding factor loadings. To simplify the calculations, mean values for each tooth in each population and rotated factor loadings were used, and, in calculating functions, the factor loadings with absolute value less than 0.7 were omitted from equations. Thus we have the following five equa-tions : Function 1 Z1 = 0.7297(dm1) + 0.8197(dm2) + 0.7778(dm1) + 0.8171(dm2) In equations here presented, symbols dm1, I1, etc. stand for mean mesiodistal crown diameters for the deciduous maxillary first molar, those of the permanent mandibular first incisor, etc., in each population. As it is easily recognized, Functions 1 through 5 represent the components which are largely related with the deciduous molars, permanent lower incisors, deciduous incisors, permanent premolars, and permanent maxillary lateral incisors, respectively. Since the rotated factor loadings used in the above equations are those computed from the correlation matrix for Aborigines, there is no proof that they could be safely extended to the other populations. However, it is quite difficult to obtain both deciduous and permanent dentitions from the same individuals, so the author dares to use them to compare the characteristics of dentition in different populations. In addition, the author should mention here that the data for the deciduous molars and incisors were obtained from plaster casts stored in the same institutions as those of the permanent dentition, and measurements were made by the present author (Table 26). In Table 27 the mean factor scores calculated by the formulae shown above, their totals in each population and percentages of each score are shown.
First of all, a rough examination shows that the overall size of the teeth involved is the largest in Aborigines and the smallest in Caucasians, the other three populations being in between. The result is quite parallel to those obtained from the deciduous and permanent dentitions separately. Secondly, based on each score and its percentage of total score, characteristics in each population may be summarized as follows: Aborigines have the largest deciduous incisors and molars in comparison with those of the other populations, but the per manent incisors and premolars do not necessarily show the largest size among the populations under consideration; Japanese carry relatively larger deciduous molars; Pimas have the largest permanent incisors, both in absolute size and in proportion, rela-tively small deciduous molars and large premolars; Caucasians show the smallest scores in every function and particularly the smallest percentage for the maxillary lateral incisors; and American Negroes carry the smallest deciduous incisors in absolute size and proportion among the five populations. These results are generally quite similar to those of previous studies by Hanihara, but slightly different in evaluation of contribution of each tooth. This naturally resuls from the difference in original correlation matrices on which the analyses have been based. |


 may be picked up for the second principal component, and the signs are minus except for that of dm 2. From this fact it may be supposed that this component mainly relates to size of the permanent incisors and canines in one direction, and the deciduous maxillary second molars in another.