PART II
PHYSICAL ANTHROPOLOGY: THE PEOPLE OF JAPAN PAST AND PRESENT
Geographic Variations in Modern Japanese Somatometric Data: A Secular Change Hypothesis
|
Makiko Kouchi IntroductionSomatometric data have been used to study racial relationships on the assumption that they reflect genetic connections. It has been postulated that Somatometric data on modern Japanese exhibit definite geographic distribution patterns that may reflect migrations from the Asian continent in prehistoric times, and thus be clues to the origin of the present Japanese. However, secular changes in Somatometric data reported from all parts of the world strongly suggest that Somatometric measurements are influenced by environmental factors. Therefore, the possibility that geographic variations in Somatometric data among modern Japanese may be caused by environmental factors should be investigated. It has been shown from Somatometric data taken in the 1940s that geographic variations in Japanese somatometrics can be grouped into two patterns (Fig. 1); a northeast-south-west cline in body size (body size is greater in the northeast and smaller in the southwest); and a concentric distribution of head shape (a more brachycephalic group in and around the Kinki District, and a less brachycephalic group in the peripheral regions). Analyses of data on nutrition in the 1960s and 1970s taken from the reports of the National Nutritional Survey by the Ministry of Welfare indicate that the geographic distribution of certain kinds of nutrient intake also had a northeast-southweat orientation, and, dietary patterns showed a concentric distribution. The northcast-southwest cline of body size is highly correlated with temperature: body size is greater in the colder areas and smaller in the wanner areas. Body size is also highly correlated with nutrient intake, and the concentric distribution of head shape is highly correlated with the dietary pattern (Kouchi, 1983).
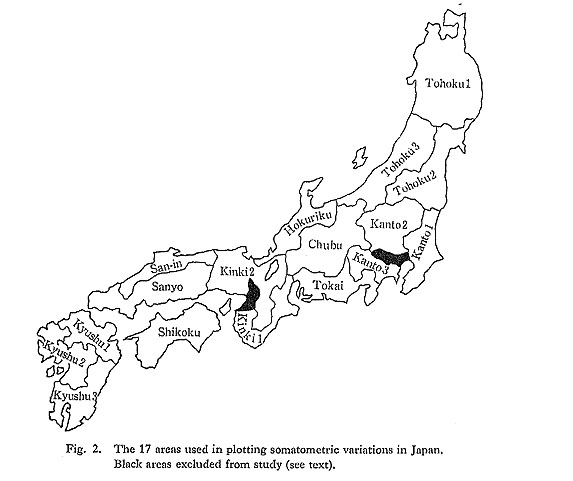
Geographic variations in Somatometric data among modern Japanese have been explained by postulating the migration of people from Korea in prehistoric times (Kohama, 1960), and by invoking racial diversity within the ancestral population (Hasebe, 1948). However, the high correlation between cephalic index and dietary pattern suggests that environmental factors may also have affected the Somatometric distributions. To explain the geographic distribution of cephalic index by environmental factors, a hypothesis was proposed that attributed the cause of the concentric distribution of the cephalic index to regional differences in the rate and timing of the rapid secular change which has taken place in recent times (Kouchi, 1983). This hypothesis is based on Somatometric data collected in the 1910s, 1940s, and 1950s, and nutritional data collected in the 1960s and 1970s. In the present study, the "secular change" hypothesis was tested by comparing new somatometric data collected in the 1980s with the older data collected in the 1940s and 1910s. There is a possibility that the observed differences in geographic variation between the somatometric data of the 1940s and those of the 1910s might be due to inter-observer measurement errors in the 1940s data. This possibility can be examined using new somatometric data collected mainly by one observer. Materials and MethodsThe present (1980s) data consist of measurements of 2,898 male students aged 18 years or older, born between 1955 and 1964. Height, head length, head breadth, bizygomatic breadth, and weight with clothing were measured according to Martin und Saller (1957). Most of the measurements were taken by a single observer during 1982 and 1983, with the remaining data collected by three other observers. In the analysis, Japan was divided into 17 areas (Fig. 2). Hokkaido was excluded because most of its inhabitants are migrants from other main islands of Japan who came there after the mid-nineteenth century. Also, the Tokyo metropolis and Osaka Prefecture were excluded because of the large influx of people into these two regions from all over Japan.
Each subject was included in one of the 17 areas on the basis of his grandparents' birth places: when three or four grandparents came from the same prefecture, the subject was classified into the area which included that prefecture. Numbers and mean ages of subjects for each area are shown in Table 1. Each area has at least 83 subjects, and mean age for the various areas ranges from 20.3 to 21.9 years. For the analyses, height, head length, head breadth, and cephalic index were used. The basic statistics are shown in Table 2.
Analysis of variance was used to test the equality of the 17 means as well as to test whether the variation for geographic position was significantly greater than the intra population variance. Geographic position was represented by the latitude and longitude of the centroid of each area. Spearman's rank order correlation coefficients comparing somatometric measurements with geographic position and average temperature in January (the coldest month) and August (the hottest month) were calculated. Somatometric data collected in the 1910s and 1940s were used for comparison with newly collected 1980s data. Data for the 1910s, from the Matsumura series, included 6,000 male students aged 21 years or older, who were observed by Matsumura between 1911 and 1917 (Matsumura, 1925). The measurements recorded were height, head length, head breadth, and cephalic index. Data for the 1940s, from the Nishi series (Nishi, 1952), have been fully analyzed (Kouchi, 1983), The subjects used were 3,564 male students aged 18 years or older, who were born between 1916 and 1926. Measurements were taken by the members of the National Physical Survey Commission between 1942 and 1945. Penrose's shape distances between the different populations were calculated using height, head length, and head breadth within each of the three somatometric series, and cluster analysis (group average method) was applied to the distance matrices to compare the pattern of geographic variation in the 1910s, 1940s, and 1980s. Calculations were done on the OKI if-800 microcomputer. ResultsTable 3 shows the results of the analysis of variance. Height and head breadth show significant geographic variation for both latitude and longitude. It is interesting to note that head breadth shows significant geographic variation but head length does not. This is the opposite of the results from the Nishi series of the 1940s (Kouchi, 1983). Further- more, geographic variation of cephalic index by latitude is not significant in the 1980s series.
Table 4 shows Spearman's rank order correlation coefficients between somatometric variables and latitude or longitude. The significant correlations between height and latitude or longitude indicate that height shows a northeast-southwest cline. Height is also significantly correlated with temperatures in January and August (Table 5). These results agree with the results from the Nishi series.
The cephalic variables in the 1980s data do not show a northeast-southwest cline, and are not correlated with temperature. The distribution pattern of cephalic index is concentric (Fig. 3), but differs from the Nishi series (Fig. 1) and Matsumura series (Matsumura, 1925) in that the region around the Kinki District ceases to be the center of brachycephaly.
Figures 4, 5, and 6 are scattergrams of the populations of the Matsumura, Nishi, and present series based on height-head breadth, height-head length, and head length-head breadth, respectively. They show that height is greatest in the present series, followed by the Nishi series. Head breadth is also greatest in the present series, followed by the Nishi series. In head length, however, the Matsumura series has the largest values, followed by the present series. This indicates that the brachycephalization occurring between the time of the Matsumura series and that of the Nishi series was due to an increase in head breadth as well as a decrease in head length. The further brachycephalization occurring between the Nishi and. the present series is due to an increase of head breadth. This is in agreement with findings by Ikeda and others (1953) and Morita and Ohtsuki (1973). It is also shown that the secular change in height and head breadth between the 1940s and 1980s is greater than that between the 1910s and 1940s.
Figure 7 shows the dendrograms for the Matsumura, Nishi, and present series obtained from duster analyses of Penrose's shape distances. In each series, the 17 samples are divided into two groups. It is clear from the comparison of the distribution of the cephalic index (Fig. 3) and the results of the cluster analysis (Fig. 7c, Fig. 8c) on the present series that each of the two groups corresponds to a more brachycephalic group and a less brachycephalic group. In the Matsumura series, 7 populations (Tohoku-1, Tokai, Chubu, Kinki-1, Kinki-2, Sanyo, and Kyushu-3) belong to the more brachycephalic group. In the Nishi series, 11 of the samples (Tohoku-2, Kanto-1, Tokai, Chubu, Kinki-1, Kinki-2, Sanyo, San-in, Shikoku, Kyushu-2, and Kyushu-3) belong to the more brachycephalic group. In both series, the samples from Kinki District are in the center of the distribution. However, in the present series, the Tohoku-2, Tohoku-3, Kanto-1, Kanto-2, Kanto-3, Tokai, Chubu, Hokuriku, Kinki-2, and San-in samples belong to the more brachycephalic group, and the Kinki District is no longer the center of the distribution, as illustrated in Fig. 8.
Figure 7 also indicates that the difference between the more brachycephalic group and the less brachycephalic group has become smaller and smaller since the 1910s. Because the present data were collected by only a few observers, unlike in the Nishi series, the increase in homogeneity and the change in distribution are not considered to be due to inter-observer measurement errors. DiscussionRegional differences in cephalic index during the 1940s were highly correlated with regional differences in dietary pattern observed in the 1960s and 1970s (Kouchi, 1983). However, the regional differences in cephalic index during the 1980s no longer have a significant correlation with regional differences in the dietary pattern observed in the 1960s and 1970s, during which period the subjects of the 1980s series were growing up. This indicates that the factor responsible for geographic variation in cephalic index is probably not the dietary pattern or cultural tradition itself. The present results indicate that geographic patterns of somatometric development have been changing throughout the twentieth century, and that the distribution observed in the 1910s is probably a transitional stage. Because secular change in somatometric measurements has proceeded in the same direction in all regions, it is reasonable to attribute the change in geographic distribution of somatometric features to geographic differences in the rate and timing of the rapid secular change. Thus, the new data of the 1980s are compatible with the secular change hypothesis. By contrast, the shift of the center of brachycephaly between the 1940s and 1980s is not compatible with the hypothesis which explains the geographic distribution of cephalic index by the effects of migrations from Korea in prehistoric times. If the geographic variation of the cephalic index is determined by a genetic factor, it should be more stable. Also, the remarkable brachycephalization which took place between the 1910s and 1980s strongly suggests that the cephalic index is not a reliable racial characteristic. There remain two questions about the secular change hypothesis: what is the cause of the observed secular change? and why do height and cephalic index, both of which have experienced rapid secular change between the 1910s and 1980s, have different distribution patterns? As previously noted, the cause of the regional differences in the rate of brachycephalization may not be dietary. A plausible factor is change In living conditions. Living conditions have changed drastically in the last 100 years. Since the regions around the Kinki District have been culturally advanced throughout historic times, it is reasonable to consider that the postulated changes in living conditions first took place in these regions. Homogenization of living conditions with the development of mass communication and mass transportation facilities, as well as the increased importance of the Tokyo metropolis as a cultural center, can explain the observed decrease in geographic variation and the shift of the center of brachycephaly in the Japanese somatometric data of the twentieth century. Heterosis has been identified as another possible cause of secular change (Ikeda, 1981). It could, thus, be an indirect causative factor behind changes in geographic variation, but this seems implausible in the present case, because there is no reason to suppose that subjects from the more brachycephalic group are more genetically heterogeneous than subjects from the less brachycephalic group. The northeast-southwest cline in height observed in the data for both the 1940s and 1980s suggests that body size is influenced by factors which are less changeable than the factors which influence the cephalic index. Significant correlation between body size and temperature suggests a physiological adaptation to climate. In the last 100 years the Japanese have experienced the most drastic cultural changes. Therefore, it is uncertain to what degree the present results, obtained from somatometric data of the twentieth century, are relevant to understanding geographic variation in the Japanese population of historic and prehistoric times. However, it is quite probable that what has happened to the present-day Japanese may have also happened in the pastalthough the rate may have been much slower. The next step should be a synthesis of skeletal and somatometric studies. The present results suggest that it is necessary for studies of racial similarity based on somatometric data to clarify the effects of secular change in population characteristics. Summary and Conclusions1) A secular change hypothesis, which attributes the cause of concentric distribution patterns in cephalic index to geographic differences in the rate and timing of the rapid secular change in recent times, was examined through analysis of somatometric data for the 1980s and comparison with earlier data. 2) The present somatometric data series consists of height, head length, head breadth, and cephalic index taken on 2,898 male students. Analysis of variance indicated that height and head breadth showed significant geographic variation. 3) Height shows a northeast-southwest clinal distribution, and is significantly correlated with temperature. These results confirm previous conclusions based on the Nishi series of the 1940s. 4) Cephalic index shows a concentric distribution pattern, but the regions around the Kinki District are not now the center of brachycephaly, as they were in the earlier data. 5) The subjects of the present series are taller and more brachycephalic than the subjects of the Nishi series of the 1940s and the Matsumura series of the 1910s. Brachycephalization between the 1940s and 1980s was caused by an increase in head breadth. 6) Cluster analyses of Penrose's shape distances show that the 17 populations studied are divided into two groups in each of the three series: a more brachycephalic group located in the central part of Japan, and a less brachycephalic group in peripheral regions. The results also indicate that the difference between the two groups has steadily decreased up to the present time, and that the center of the distribution of the more brachycephalic group has shifted eastwards between the 1940s and the 1980s. 7) The decrease in geographic differences and the shift in the center of distribution of brachycephaly which took place between the 1940s and 1980s are compatible with the secular change hypothesis, but not with the traditional migration hypothesis of Kohama (1960). 8) The fact that the correlation between cephalic index and dietary pattern was significant only in the 1940s indicates that the dietary pattern itself is probably not the direct cause of brachycephalization. As a possible causative factor, secular changes in living conditions were discussed. AcknowledgementsI wish to thank Drs. M. Tokutome, S. Kato, and S. Takeuchi of The Jikei University School of Medicine, and Drs. Y. Naito and T. Matsushita of the Nagasaki University School of Medicine for generously permitting the use of their somatometric data. I am most grateful to the following for their kindness and offices: Dr. T. Kamegai, Iwate Medical College School of Dentistry; Dr. T. Suzuki and Mr. T. Hanihara, Yamagata University School of Medicine; Dr. K. Hattori, Ibaraki University, Department of Liberal Arts; Drs. M. Katagiri and H. Tahara, Utsunomiya University, Faculty of Education; Dr. H. Koike, Saitama University, Department of Liberal Arts; Dr. Y. Kikuchi, Chiba University, Faculty of Technology; Drs. B. Endo and T. Nishida, The University of Tokyo, Faculty of Science; Dr. H. Hoshi, The University of Tokyo, Faculty of Medicine; Dr. T. Arakawa, The University of Tokyo, Faculty of Technology; Drs. K. Suzuki, S. Nagashima, and K. Hyodo, The University of Tokyo, Department of Liberal Arts; Dr. F. Ohtsuki, Tokyo University of Agriculture and Technology, Faculty of General Education; Dr. I. Asami, Juntendo University School of Medicine; Dr. N. Yamazaki, Keio University, Faculty of Technology; Drs. H. lijima and A. Kamata, Kanagawa University, Department of Liberal Arts; Dr. H. Terashima, Fukui University, Faculty of Education; Dr. T. Osa, Tsuru University of Liberal Arts; Dr. T. Endo, Yamanashi University, Faculty of Education; Dr. S. Hayama, Kansai Medical College; Drs. S. Akasaka and K. Tsuruta, Kinki University, Department of Liberal Arts; Dr. K. Tanaka, Tottori University School of Medicine; Dr. T. Kawano, Hiroshima Denki Institute of Technology; Dr. G. Ito, Kagoshima University School of Dentistry, I also thank Mrs. M. Hasegawa, Mr. K. Koizumi, Mrs. Y. Koizumi, Mr. K. Adachi, Mr. K. Misumi and Miss A. Uchida of The University of Tokyo, Faculty of Science, for their assistance in the somatometric research, as well as all the volunteer students who participated in the study. Special thanks are due to Dr. W. C. Chumlea and Mrs. L. Croutwater of Fels Research Institute for their kind advice on the preparation of the manuscript. Part of this somatometric research was financially supported by a grant-in-aid for scientific research from the Ministry of Education, Science and Culture, Japan (G-57340052). References
|