PART I
ARCHAEOLOGY: JOMON HUNTER-GATHERER
SUBSISTENCE AND SETTLEMENT
Volumetry and Nutritional Analysis of a Jomon Shell-Midden
|
Kimio Suzuki IntroductionMore than a half century ago, Nelson (1910) estimated the total volume of prehistoric shell deposits at Ellis Landing near Richmond, California at 1,260,000 cubic feet. His estimate assumed that the daily shellfish consumption of 100 residents, whose population size was determined by archaeological evidence and his own assumptions, would have produced a cubic foot of shell deposit. Thus, he calculated the length of formation of the Ellis Landing shell-midden at about 3,500 years. Gifford (1916) calculated the total weight of the same shell-midden deposits at 51,085 short tons. He then extracted the total shell weight from the above figure by using a wet screening technique to remove non-shell remains from his analytical samples, and, finally, estimated the amount of daily shellfish consumption per 100 people at 25.18 kg. His result, however, was not independent of Nelson's since he had adopted the latter's figure of 3,500 years as the length of time involved in formation of the midden. Therefore, both analyses of daily shellfish were prejudiced; Cook (1946) criticized them as being based on "pure guess." Cook (1946) and Shawcross (1967) furthered this line of study utilizing palaeonutritional analysis. Cook, in reviewing the Nelson-Gifford analyses, had pointed out that the presence of shellfish was of major importance for the maintenance of an adequate intake of protein in prehistoric times, and Shawcross demonstrated this point through his field work on a shell-midden located in the Galatea Bay region, New Zealand. He excavated 18.7 m3 of shell deposit and converted this figure into 26.9 tons of raw weight, 11 tons of shell weight, 4,234 kg of flesh weight, and finally, 2,752,116 kcal, which was 92.3% of the total calories calculated from all the faunal remains recovered from his excavation. It was still obscure, however, to what degree the above caloric intake had actually contributed to the residential stability of the midden people, which was the very point of his research. First, although he excavated nearly half of the midden, he could not reasonably estimate the total amount of the shell deposits, which was to be the basis of his analysis; second, other resources, especially vegetables, were not considered due to a lack of archaeological evidence; third, there were no reliable data on the length of time over which the shell-midden was formed, or the population size of the group responsible for its forma- tion; and finally, there were some technical problems concerning the shell volume-weight conversion. Recent developments in ethno-archaeological research have shown interesting parallels in shellfish gathering among contemporary aborigines. Meehan (1977) reported that on the average, 34 Anbara people in northern Australia consumed seven tons of shellfish in a year. But the energetic contribution from that harvest was less than 10% of their daily caloric intake, which ranged from 1,600 to 2,500 kcal seasonally. However, the Anbara people, regardless of the fact that shellfish had low caloric value, recognized it as one of their important resources to the extent that they placed their settlement at a reasonable distance from the shell bed. This implies that shellfish, as a prehistoric resource, has some seemingly contradictory characteristics. Low caloric value and a low ratio of net against gross weight indicate that it is likely to be treated as a coarse food, while on the other hand, the facility of gathering and cooking, the multi-seasonal availability and prolificity seem to indicate it as an ideal resource in prehistory. Meehan concluded that shellfish gathering was not to be measured solely in terms of its gross energetic contribution to the diet, and that this had perhaps been overemphasized in the archaeological context. She proposed that the significance of a shellfish gathering economy should be considered in a much wider cultural context. In reviewing preceding works on prehistoric shell-middens, one can point out that the lack of a proper method for estimating the total volume of shell deposits has been an obstacle to further discussion. Four major variables have been considered when analyzing prehistoric shell-middens: 1) the size of the shell-midden, represented by the total volume or weight of the shell deposits; 2) the length of time required for the formation of the deposits or the length of occupation of the midden; 3) the size of the population contributing to form the deposit; and 4) the daily or yearly consumption of shellfish per person. Due to the high correlation between these variables, control is essential in analyzing prehistoric shell-middens. Among them, time can easily be fixed by 14C dating or any other chronological approach, and population is also calculable through several kinds of archaeological evidence such as numbers and sizes of dwellings, variety among artifact assemblages, and so forth. Consumption can be modeled through good ethno-archae-ological examples such as those shown by Meehan. Therefore, this paper focuses on the size variable, and the problem of establishing a system of volume analysis; that is, a proper method of estimating the total volume/weight of shell deposits. This method is then applied to the Isarago shell-midden near Tokyo Bay. The location of the Isarago shell-midden is shown in Fig. 1. It is a single component site characterized by early late Jomon Horinouchi I type pottery (dating to about 4000 B.P.). The excavation of the site started in the summer of 1978 and was completed at the end of 1979. The site report was published in the spring of 1981 (Suzuki, 1981). One of the major tasks during the excavation was to estimate accurately the depositional volume of the midden in order to analyze the nutritional contribution of shellfish to the Isarago residents' diet.
Method of Volume AnalysisSince the typical shell deposit is irregular in all three dimensions, its true value in volume cannot be measured using a single formula. We therefore have to adopt different ways of measurement and approach the apporoximate value through comparison of their results. Three methods arc used here for this purpose; they are termed the 1) Contour, 2) Prism and 3) Average Thickness methods.
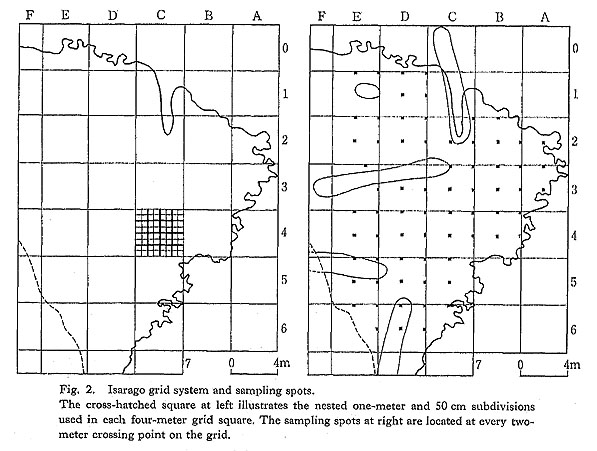
Contour Method (Fig. 3-1)The details of the surface and base of the shell deposit are surveyed by photography, and two maps, surface and bottom, are drawn on a scale of 1 to 20 with 5 cm contours. Areas bounded by each contour interval are cut from the maps and each cutout is stuck on a drum covered with black wool-coated paper. The drum is then rotated at a high speed and the amount of area is accurately measured by scanning with a brightness sensor. In this method, the total volume of the shell deposits is considered to be the product of the integrated areas defined by each contour interval and 5 cm increments of contour height. The contour method is used in surveying intricate areas of land such as is needed in estimating reservoir capacity. It is considered to be highly accurate. Prism Method (Fig. 3-2)The area of the shell deposit is surveyed by photography on a scale of 1 to 20. Then a 50 cm grid is set up over the area (Fig. 2: left) and the elevations ASL (above sea level) of all the crossing points of the grid, located either on the surface or the base of the deposit, are measured so that the deposit may be divided into 50 cm square prisms. The four values, both for the surface and the bottom of the deposit, are then averaged. The difference between two averaged levels can be considered to be the height of a square prism. In this way, the shell deposit can be regarded as a collection of 50 cm2 prisms, the height of which may correspond to the thickness of the deposit.
In the excavation of the Isarago shell-midden, the following three variants were used: photo-surveyed 50 cm2 prisms, manually surveyed 50 cm2 prisms, and manually surveyed 1 m2 prisms, termed here Prisms X, Y, and Z, respectively. The major difference between X on the one hand, and Y and Z on the other, is in the devices used in measuring the crossing points. In constructing Prism X, the crossing points are measured by a stereo camera (WILD C-120) and an aerial camera (WILD RC-5). Prisms Y and Z are measured by the leveling devices used in ordinary surveying. Different methods were adopted in order to check the average error due to differences in measurement. The Prism Z approach was designed to simplify the process of calculation in the Prism Y method. Average Thickness (Fig. 3-3)The difference between two ASL measurements at the grid crossing points on the surface and the bottom of the shell deposit can be considered the thickness of the deposit. Then it follows that the total average of the differences can be regarded as the average thickness of the deposit, and the total volume (V) will be the product of the average thickness ( V= As this method is relatively simple compared to the above two, if it is sufficiently accurate, it will be greatly appreciated by shell-midden excavators, especially those who have limited financial support or are poorly equipped. Here two variants, Average Thickness A (50 cm thickness) and Average Thickness B (1 m thickness) are used. In the former approach, every 50 cm crossing point on the grid is used to get the average thickness. The total number of the points used at the Isarago site was 1,430 and 0.8567 m was the resulting average thickness of the deposit. The latter approach was designed for the simplification of the former; in it the thickness at every 1 m crossing point of the grid was used. In the Isarago shell-midden the total number of points used in measuring Average Thickness B was 368 and the resulting average thickness of the shell deposit was 0.8509 m. Both calculations used the independently measured value of 351 m2 for the area covered by the shell deposits. Comparison of Results and Their EvaluationThe volumes arrived at for the Isarago shell deposit by the above methods are shown in Table 1. Of these, the contour method gives the smallest value at 290.3 m3, and the Average Thickness A method gives the largest at 300.7 m. This supports the normal expectation that a more precise method will produce smaller values. In this sense, the results of the Prism X analysis are also satisfactory.
We can make a valuable observation comparing the Prism X and Y results. The two share the same theory of calculation except for the one difference in measuring mentioned above. The Prism Y results are presumed to contain various accumulated measurement errors due to the manual surveying, which continued for more than 18 months. This, however, has little effect on the result, judging from the fact that the difference between the two methods is less than 2%. It is therefore evident that the reliability of the Prism Y method is comparable to that of Prism X and that Y can be used in place of X, which is relatively expensive. The results of the two Average Thickness methods give larger values than those of the Contour and Prism methods but their differences are limited to within 4% of the Contour method values. If distance within 5% is considered negligible in the estimation, then the Average Thickness method can be considered to be the most practical one. Though the Contour and Prism X methods are highly accurate, they have some disadvantages when it comes to excavation. For example, maintenance of already exposed deposit surfaces is required. Since photo-surveying is done immediately after the whole surface of the deposit has been exposed, maintenance will be an obstacle during the excavation, e.g. during the removal of surface soil. Moreover, one will not be able to start excavation of the shell deposit until the survey has been completed, and this will lengthen the period of the excavation. The above drawbacks can be reduced by the introduction of the Prism Y or Z methods, since they can be carried out in conjunction with the excavation of the deposit. However, even with the Prism Y and Z methods, complex calculations and relatively heavy expense are inevitable. In addition, these methods cannot be applied to previously known partial data such as the trench profiles of middens available in already published site reports. If we can estimate approximately the total volume of shell deposits from partial data of this kind, we may have a wider scope in the comparative study of shellmiddens. For this reason, we have to further examine and evaluate the potential and practicality of the Average Thickness method. As has already been shown in the formula for Average Thickness, The results are shown in Table 2. Average Thickness Variants C, D, and E yielded large values which exceeded Contour and Average Thickness A values by more than 10% and 5%, respectively. This implies that volumes calculated by these variant methods will include errors which significantly affect the results. We have to assume, therefore, that volumes estimated by using a trench profile from past investigations will be 10 to 20% larger than will precisely estimated volumes. The test prepared for partial grid excavation shows an unstable result. The value for Average Thickness F is nearly 10% smaller, while on the contrary, that for Average Thickness G is 20% larger than the value yielded by the Contour method. This suggests that Variants F and G are less reliable than variants C, D, and E. Estimation by these methods is therefore not recommended. The results of analyses using variants H to N are reasonable and reliable results will be obtained if more than twothirds of all crossing points are used, as shown in the results of the Variant L, M, and N analyses.
To summarize, in theory the most accurate way to estimate the total volume of a shell deposit is the Contour method, and any Prism method will be less precise. In practice, however, if it is necessary to synchronize the process of surveying with the excavation's progress, the Prism Y and Z and Average Thickness A and B methods are recommended. If the excavation is operating under restricted conditions such as time or money shortages, or only partial excavation of the deposit is planned, Average Thickness measures C, D, and E should be used. In the following analysis, the value of 290.3 m3 for the Isarago shell deposit, which was quantified by the Contour method, will be used as the most reliable value against which other estimates will be checked. Volume-Weight ConversionThere are several possible ways of converting the volume of a deposit into a weight measurement. Three methods are proposed in this paper. They are termed the Two-Step Conversion, the One-Step Conversion, and Direct Conversion. Their results, shown in Table 3, are compared in the same way as in the previous section.
Two-Step ConversionFirst the value for total volume of the shell deposit is converted into a figure for the total weight of the deposit. A column sample of the shell deposit is used for this purpose. Samples are cut out of the deposit in 25 × 25 × 5 cm pieces from sampling spots systematically located at the corner of every 2 m crossing point on the grid (Fig. 2, right; Fig. 4). Each sample is then dried in order to measure its dry weight in equalized volume. In the Isarago shell-midden, 145 randomly sampled cuts were used to obtain the average weight and the resulting figure was 3.6±0.8 kg per 3,125 cm3 (25 × 25 × 5 cm) of material. Thus, the total weight of the shell deposit was calculated as in the following formula: 290.3 m3 × (3.6±0.8) kg × 320=334.4±74.3 tons The extraction of the total shell weight from the above figure is the second step of the conversion. The ratio of shell weight to the whole weight of each sample was measured through the wet screening technique by using screens of 10 mm, 4 mm, 2 mm, and 1 mm mesh (Fig. 5). Shells which were caught on the 10 mm mesh were collected and their dry weight measured. The averaged ratio obtained from the above 145 samples was 0.62±0.18. The total shell weight was then calculated using the following formula:
(334.4±74.3) tons × (0.62±0.18)=207.3±119.6 tons The concept of this conversion is basically similar to that of Shawcross (1967), although he used a different process of measuring the weight of a shell deposit in equalized volume. He excavated the deposit first, and then the volume of the unit weight of the softened deposit was measured by repacking it into a scaled box.
One-Step ConversionIn this method, the total weight of shell is calculated by the product of the total volume of the deposit and the average shell weight per unit volume of deposit. Another 176 randomly selected samples were used to obtain average shell weight per unit volume in the same manner as employed in the Two-Step Conversion. The resulting figure was 2.155±0.82 kg per 3,125 cm3 and the total shell weight of the Isarago deposit was quantified using the following formula: 290.3 m3 × (2.155±0.825) kg × 320=200.18±76.63 tons The figure obtained by this method is very comparable to that of the Two-Step Conversion. It is therefore evident that the One-Step Conversion has an advantage over the Two Step Conversion, since the calculation process is simplified and the range of error is also smaller. Direct ConversionIn the final method to be discussed the total shell weight is calculated by the product of the distributional area and the average shell weight per square unit of the shell deposit. In the Isarago shell midden, 36 column samples of 25 × 25 cm (see Fig. 2) were processed by the wet-screening method (Fig. 5). The weights of shell from each of the 36 samples were added together, to arrive at a total weight of 1358.2867 kg. This figure was multiplied by 16 to convert it to a weight equivalent to that of 36 one-meter square columns. This calculated weight was then divided by 36 to arrive at an average weight for a one-meter square column, as in the following formula: 1358.2867 kg × 16÷36=603.683 kg The total weight of shell in the midden was finally obtained by multiplying the total surface area of the midden times the average weight for a one square meter column of deposit, as follows: 351 m2 × 603.683 kg=211.9 tons The results obtained by the above three methods are close to each other and the difference between the largest and smallest figures is only about 12 tons, or 6%. It is therefore reasonable to estimate the total shell weight of the Isarago shell-midden at about 200 tons, which will be the figure used in the following section. If the total volume of the deposit is known, the best method is the One-Step Conversion. However, if it ia not known, the Direct Conversion will be useful since it is applicable to partial excavation or previously collected data. The Two-Step Conversion is not recommended due to the increase of error entailed in the calculation process. Nutritional EvaluationThe molluscan assemblage of the Isarago shell-midden consisted primarily of 10 marine species including nine bivalves and a gastropod. Their weight proportions, as determined by 816 sample cuts, are shown in Table 4. These figures were used to divide the 200 tons of total shell weight into the shell weights for each individual species. This was then converted into the gross weight of the shellfish, from which the flesh weight was finally extracted by using the present refuse/gross ratio for shellfish shown in the Japan Food Composition Tables.
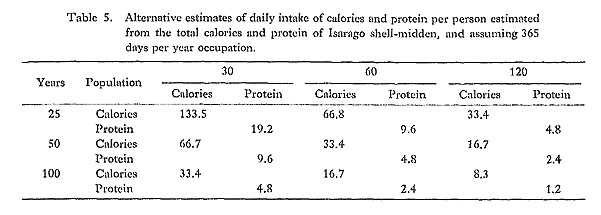
In the process of calculation, the refuse/gross ratio of Anadara broughtoni was used for A. granosa and A. subcrenata as all three are of the Anadara genus. The ratios of five species, accounting for 17% of the total shell weight, were not listed in the Food Composition Tables as these shellfish are no longer part of the Japanese diet. They were therefore not included in the calculation. As a result, about 83% of total shell weight was converted into 41.02 tons of flesh weight, from which was calculated a total of 36,552,500 kcal and 5,266,840 g of protein. The final question of the present paper is to examine to what extent the above yields contributed to the subsistence of the Isarago shell-midden residents. If we use the three alternate figures of 25, 50 and 100 for the number of years it took the shell-midden to form, and 30, 60 and 120 as alternative estimates of the population size (as estimated from Jomon pottery chronology, 14C dates and the average size of Jomon settlements), the maximum daily intake per person over the course of a year would have been 133.5 kcal and 19.2 g of protein, as shown in Table 5.
If we assume the average daily caloric intake for an Isarago resident at between 1,500 and 2,000 kcal, the above estimated 133.5 kcal is approximately 6.7 to 8.9% of the total intake. These figures arc comparable to those for the Anbara people in Australia (Meehan, 1977). However, an important difference exists between the Anbara and the Isarago inhabitants. In the former group, shellfish were consumed throughout the year with little variation between seasons, but two species consumed by the Isarago, Anadara granosa and Meretrix lusoria, were gathered only from the beginning of spring to early summer, as shown by analysis of the daily growth rings (Koike, 1981). The fishscale analysis also shows that fishing for Acanthopagrus schelgeli was practiced mainly in the summer (Ushijima, 1981). Together with other evidence such as the lack of deer and wild boar bones, the absence of pestles and mortars which might indicate nut processing, and the absence of human bones which might indicate funeral activities at the midden, we can conclude that the Isarago shell-midden, unlike many other Jomon shell-middens, was not a permanent occupation site, but a temporary shellfishing camp. Evidence also indicates that about half of the Isarago shellfish were consumed within a 120-day period from spring to early summer. Calories and protein obtained from A. granosa and M. lusoria were determined at 17,664,000 kcal and 3,079,500 g, respectively. The daily intake of calories and protein per person for a 120-day period was recalculated in the same manner already mentioned and the results are shown in Table 6. Of these figures, the maximum daily intake of 34.1 g of protein is remarkable since it corresponds to 43% of the present Japanese standard. In addition, if oysters (Crassostrea gigas), comprising 27% of the total shell weight, were also consumed during the 240 days from September to April as they are today, the maximum daily intake of protein in the spring season would have been 44.3 g, which is almost 60% of the present daily intake.
Judging from the above data, one may assume that about one-fourth of the annual protein intake of the Isarago residents was in the form of shellfish. If they also had access to other resources such as nuts, animals, and fish, their intake of protein would have reached a quite high standard for a prehistoric hunter-gatherer society. It seems evident that shellfish played an important role as a source of protein in the Jomon diet and for this reason numerous shell-middens occurred in different areas and periods in Jomon prehistory. Size Comparison of Late Jomon Shell-MiddensThe sizes of Jomon shell-middens have hitherto been represented and compared by their area. For example, the Kasori shell-midden, which covers nearly one acre (9.453 m2), has been considered one of the largest middens in prehistoric Japan. If we compare the 700 m2 of the Isarago shell-midden to that figure, Isarago has less than one-thirteenth of the area of Kasori and this seemingly implies that Jomon shell-middens vary greatly in size. However, the picture changes significantly if we compare the middens not in terms of area but of volume. Table 7 shows the areas and volumes of three late Jomon shell-middens, as estimated by the methods developed in this paper. The Kidosaku volume was estimated by the Average Thickness B method and the Kasori volume by the Average Thickness C method. The ratio of the Isarago, Kidosaku, and Kasori sites to one another in terms of area is 1: 2: 13. But when volumes are compared, the ratio is reduced to 1: 0.8: 9. This indicates that the shell deposits of the Kidosaku, and Kasori middens were thinner, but morewidely distributed than those of Isarago. It is also evident that volume is a more reasonable unit than area to use in measuring the size of shell deposits, since it takes into account three dimensions rather than only two.
Another important point to consider in comparing shell-midden size is the duration of the site. For example, if two shell-middens were formed respectively by two different groups of people whose population size and level of shellfish consumption were basically similar, the size of the two middens would have been dominantly determined by the length of occupation. Therefore, equalization of duration is essential to the comparison of shell middens. Among the three middens used here as examples, the Isarago and Kidosaku sites can be considered to have the same duration; only a single pottery type, Horinouchi I of early late Jomon, was recovered from them. The Kasori site, on the contrary, has a longer duration. It contains pottery ranging from the Shomyoji to the Soya types, which covers almost the entire range of the late Jomon period. Thus the duration of occupation at Kasori was about seven times as long as Isarago and Kidosaku. It is therefore necessary to correlate Kasori's duration with that of Isarago and Kidosaku. The revised ratio of the three shell-middens to each other in terms of volume per unit time is 1: 0.8: 1.3, as shown in Table 7. This result clearly demonstrates that the accumulation rates for the three middens were about the same. Thus, Kasori no longer appears to represent one of the largest Jomon settlements, but instead a settlement of average size that endured for a long time. This finally suggests that the sizes of the human groups that formed the late Jomon shell-middens were basically equal. This is contrary to some previous Japanese archaeologists' argument, which states that the relatively wide variation in size of late Jomon middens is indicative of an uneven distribution of population. In particular this argument has been made with reference to Kasori and other seemingly large-scale shell-middens (e.g. Tsuboi, 1962). The longer duration of Kasori as against the Isarago and Kidosaku shell-middens may be due to environmental factors such as the stability and availability of subsistence resources. The environmental setting occupied by the Kasori residents seemingly offered stable enough resources that continuous and/or multiple occupation was possible if the number of residents was not much larger than at Isarago and Kidosaku. At Isarago and Kidosaku, on the other hand, the site surroundings apparently could not produce stable enough resources to support long-term occupation, and the residents had to shift their settlement elsewhere after a relatively short time. Concluding RemarksA systematic and quantitative volumetric analysis of Jomon shell-middens has revealed some interesting aspects of Jomon hunter-gatherer society. The nutritional contribution of shellfish to the Jomon diet is clarified, and a basic pattern in the paleo-demography of late Jomon shell-midden people is suggested. As shown above, and as contemporary ethno-archaeological data have suggested, the role of shellfish in prehistoric diet was not as a supplier of calories, but as one of the major, stable sources of protein. It should be noted, however, that a number of permanent residential sites also occurred in inland parts of Japan throughout the Jomon period. This seems to indicate that peoples in those areas must have developed other stable protein sources instead of shellfish-walnuts, Torreya nucifera seeds, hazel nuts, and so forth. This underscores the diversity and abundance of Jomon hunter-gatherer subsistence. Koyama (1978) states that the stability of Jomon subsistence enabled Jomon society to have a relatively high density of population for prehistoric hunter-gatherers. The result of the size comparison in this paper among three late Jomon shell-middens of equalized duration shows, however, that the shell deposits of the three middens basically accumulated at the same rate over time. This indicates not only the basic homogeneity of Jomon shell-midden size at any one period, but also counters a previous view of Jomon society based on the premise that seemingly large-scale shell-middens reflected a high density of population. According to this view, some sort of agriculture (mainly root crops) must have been practiced among the shell-midden people in order for them to maintain such a high population density. Finally, there is the question of the general applicability of the methods developed in this paper. Perhaps some revisions will be required when this method is applied to shell-middens in different parts of the world. For example, the weight ratio of shell against other refuse such as soil and/or cultural and natural remains will differ according to various factors: consumers' food habits, sedimentary environment of sites, seasonality of shellfish collecting, and so forth. In addition, different places support different species of shellfish and this will alter gross/flesh weight ratios. It must be noted, however, that none of the above are serious obstacles. Application to a much wider range of cross cultural examples should increase the sophistication of the methods proposed here, as well as their ability to reveal certain covert aspects of prehistoric society. References
|


 ) times the whole distributional area of the deposits. This can be shown in the following formula: