CHAPTER 17
Metrical Analysis of the Middle Paleolithic Flake Assemblages
in the Douara Cave Based on the Inertia Moment Method
Banri Endo
Department of Anthropology, Faculty of Science
and Department of Anthropology and Prehistory,
The University Museum, The University of Tokyo
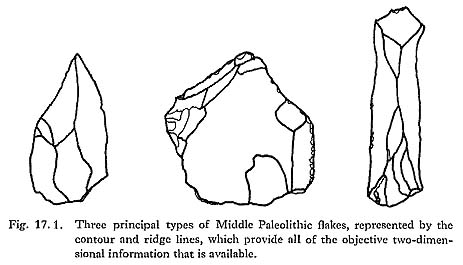
17. 1 INTRODUCTIONFor the purpose of comparing different assemblages of stone artifacts, the recognition of the form of each artifact is necessary, in the first place, and the examination of the differences or similarities in the populations-each of which consists of variously formed artifacts-in the second place. Recognition of the form of an artifact is usually made by direct observation, based on the diagnostic traits. In the field of Paleolithic prehistory, such traits are systematically described, for example,by Sonneville-Bordes and Perrot (1954, 1955, 1956a, b), Bordes (1961), Tixier (1963), McBurney (1967), Brézillon (1968), and Marks (1976). However, due to the individual way of judging by the observer concerned, subjectivity of recognition cannot completely be eliminated. To aid direct observation or to replace it, the measurement of length, breadth, thickness, etc. has sometimes been employed, as seen in the reports by Roe (1968), Wilmsen (1968), and Watanabe (1973). This kind of measurement, however, gives scanty information on the whole form of the stone artifact. Furthermore, it is difficult to determine exactly the longitudinal axis or the transverse axis of the stone artifact by such a method, because artifacts from the Paleolithic age are considerably irregular in form. Consequently, the measurement tends to be inaccurate, Comparison of populations has already been objectively carried out by applying multivariate statistical analysis, as reported by Binford and Binford (1966), Hodson (1971), and Hanihara and Akazawa (1979). All in all, it seems desirable to introduce more objective and more detailed numerical methods for the recognition of the form of stone artifacts to meet with the objective multivariate analysis, even if these methods do not give full information about the form. For example, Fig. 17. 1 shows three principal types of flake tools from the Middle Paleolithic age, i.e. point, flake, and blade. These forms seem to be quite distinguishable. However, flakes actually excavated from a site are for the most part not typical. They usually show continuous change connecting these three types, as in the case of the Paleolithic site of the Douara Cave illustrated in Fig. 17. 2. The classification of these flakes into three types or even more-such as the elongated point type, etc.-seems rather artificial and cannot be sufficiently objective. Such classification may differ according to the researcher. Therefore, it may be better to recognize the flakes by means of more objective and detailed methods of measurement.
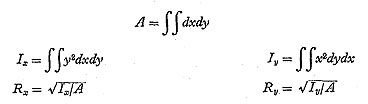
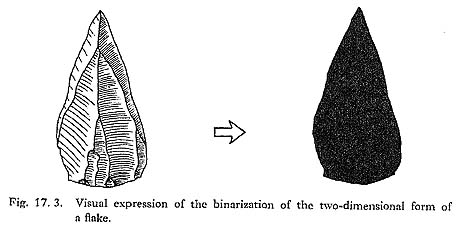
The present author (1978, 1979) has developed a more detailed, systematic method of measurement, because of the above-mentioned problems. This method is called the "inertia moment method" and is, one could say, intermediate between linear measurement and the more complicated pattern recognition. Its system and treatment are rather simple. The present report aims at solving the actual problems concerning the stone artifact assemblages from the Middle Paleolithic site of the Douara Cave by using this method. 17. 2 INERTIA MOMENT METHODGenerally in pattern recognition, the subject pattern is treated as a mathematical function, which is called the image function. A series of coefficients of this function, which can represent enough information about the pattern, is obtained from any of various complicated measurements of the two- or three-dimensional subject pattern and by means of any of a number of mathematical treatments. These coefficients are then subjected to the mathematical analysis necessary for obtaining the desired results. In the case of the inertia moment method, the subject pattern is a two-dimensional area, enclosed by a contour. The image function is as follows:
This means a binary expression, as visualized in Fig. 17. 3. The series of coefficients is a set of geometrical properties related to the kinematic mechanics of the motion of the thin plate formed by the area. They are as follows:
(cf. Fig. 17. 4). Each of these properties has concrete physical meaning in terms of mechanics, unlike the usual set of coefficients in the usual pattern recognitions, which generally has only an abstract mathematical meaning. For this reason, the author considers this method to be intermediate between the usual linear measurement method and the pattern recognition method. The concrete meanings in the inertia moment method are as follows: L= Maximum projected length along the mathematically determined longer principal axis, i.e. the longitudinal axis. B= Maximum projected breadth along the mathematically determined shorter principal axis, i.e. the transverse axis. Dx= Longitudinal distance between the mathematically determined centroid (C) and the middle point of the line segment of L. Dy= Transverse distance between the centroid (C) and the middle point of the line segment of B. A= Area of the plane enclosed by the contour of the subject figure. Ix= Moment of inertia of the area about the transverse axis (the x axis in Fig. 17. 4). Iy= Moment of inertia of the area about the longitudinal axis (they axis in Fig. 17. 4). Rx= Radius of gyration about the transverse axis. Ry= Radius of gyration about the longitudinal axis. These properties are schematically shown in Fig. 17. 4.
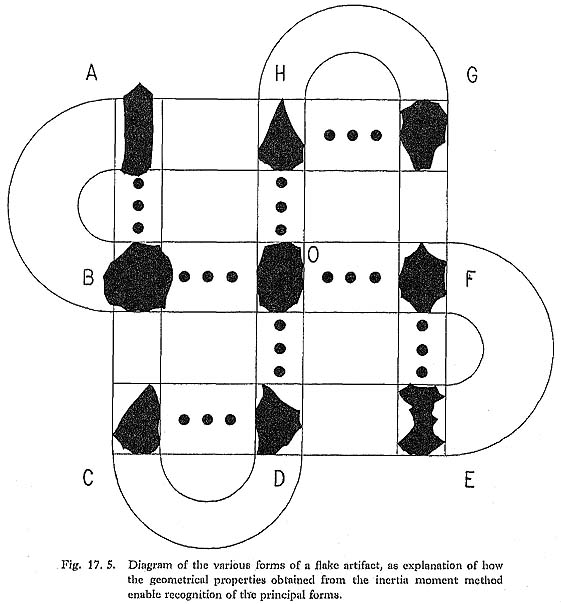
These geometrical properties enable us to recognize the principal forms. The diagram shown in Fig. 17. 5 is used to help explain this fact. The black figures schematically express the various possible forms of the unretouched flakes from the Middle Paleolithic age.
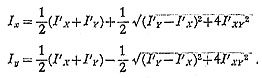
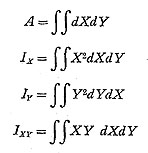
The size can theoretically be represented by the area A, although the other properties, except for Dx and Dy, are also related to the size. The radius of gyration indicates the extent of mass distribution seen from the axis through the centroid, i.e. the principal axis. For ease of understanding, we should explain that the radius of gyration is analogous to the standard deviation in statistics. The standard deviations is more important than the distribution range, as the former is more stable than the latter. The length and the breadth are analogous to the range. Accordingly, the radius of gyration is more stable than the length or breadth. For example, if the pointed head of a flake is slightly broken off, the length of the flake becomes slightly but markedly smaller, whereas its radius of gyration indicates almost no shortening-in other words, the change of the radius is practically null. In addition, the behavior of the radius of gyration differs from that of the length or breadth. In the series from A to B in Fig. 17. 5, the L and the B as well as the Rx and the Ry all vary. In the other series, namely from O to D, from O to F, and from O to H, the Rx and the Ry vary, whereas the L and the B are constant. Both the radii of gyration of D, F, and H are more or less smaller than the radii of O. The radius of gyration Rx becomes larger from F to E, whereas the Ry becomes smaller. The Dx and the Dy indicate the asymmetry around the transverse axis and around the longitudinal axis, respectively. From H to G, the Dy becomes smaller; it is positive in the case of H and negative in the case of G. From D to C, the Dy becomes smaller; it is positive in the case of D and negative in the case of C. In the case of O, the Dx and the Dy are about zero. When the change of Rx or Ry is associated with the change of the A-i.e. the pointed-ness of the top, bottom, or side-or when the constriction in the middle is related to the size, a most remarkable change takes place in the moment of inertia, namely the Ix or Iy. In order actually to measure these geometrical properties, the principal axes and the centroid must be determined. For this purpose, an arbitrary coordinate system is employed as X and as Y in Fig. 17. 6. The area, two moments of inertia, and the product of inertia are measured about these axes at the beginning. The equations for these measurements are as follows:
The position of the centroid (
Let I'X=IX- Then the moments of inertia about the principal axes are:
The inclination angle of the longitudinal principal axis is obtained as:
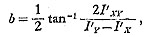
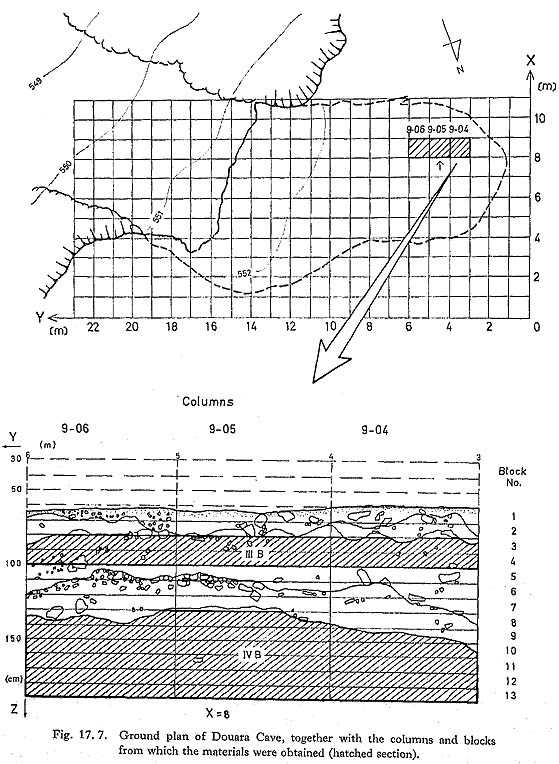
if For further explanations for the actual measurement and mathematical treatment, see Endo (1978-in Japanese with English explanation of equations and summary). As these properties are identical to the geometrical properties of cross section of a beam in terms of strength of materials, another paper (Endo and Takahashi, 1982-in English) is also available for the use of actual devices with suitable equations and the procedure of measurement. 17. 3 PROBLEMSIt has already been concluded that all the flake artifact assemblages from the strati-graphic horizons III A, III B, IV A, and IV B of the Douara Cave deposits excavated in 1974 belong to the Middle Paleolithic age, according to Akazawa (1979). However, the thickness of these layers reaches more than 1 meter, and the deposit is divided into different layers from the sedimentological point of view. The first problem is to examine whether these assemblages are homogeneous or different when the form of the flint artifacts that have been uncovered is analyzed by means of pure metrical analysis based on the inertia moment method. Because of the restricted number of artifacts, the problem is limited to a comparison between the assemblages of III B and IV B in the present study. The second problem is to find out what kind of difference among the artifacts of assemblage can be detected by numerical analysis, if such a difference exists. 17.4 MATERIALSMaterials are restricted to the specimens uncovered from Horizon III B and Horizon IV B of columns 9-04, 9-05, and 9-06. These columns are square, in a cross-section of 1 m × 1 m. They are divided into blocks, at intervals of 10 cm in depth, as seen in Fig. 17. 7. For further details, see Endo et al. (1978). Because a very high percentage of the unearthed stone artifacts is made up of unretouched flakes (Akazawa, 1979), the present study is restricted to all the complete unretouched flakes from those blocks belonging to III B and IV B.
The contours of these flakes have been are precisely projected onto sheets of paper, and the figures thus drawn were used for the measurement. The number of specimens is 53 from assemblage III B and 32 from assemblage IV B. All of the specimens are shown in Fig. 17. 8.
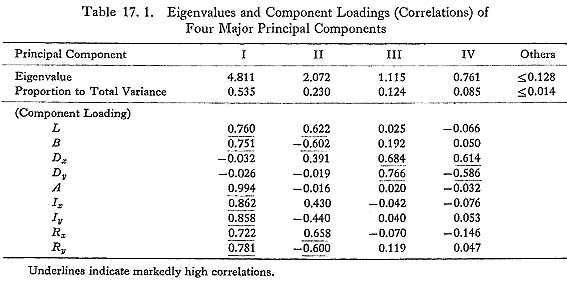
17.5 MEASUREMENTIn order to measure the geometrical properties of the inertia moment method as described above, a position and brightness sensor of the automatic mechanical scanning type (Photopattern Analyser PPA-HS, made by Rhesca Co.), connected to an on-line electronic calculator with six figures parallel BCD interface (PC-3600 made by Sharp Co.), was used in the present study. The sensing unit of this apparatus was 0.1 mm×0.l mm. A sheet of paper on which the figure of a stone artifact had been drawn was put into this apparatus for measurement. The brightness at the position in the dark area was sensed to be 1, while that at the position in the light space around the figure was 0, by adjusting the sensing level of brightness of the apparatus. Most of the geometrical properties were thus automatically measured and computed by the above equipment. Other miscellaneous treatments were manually carried out on sheets of mesh paper. 17. 6 EXTRACTION OF SIGNIFICANT FACTORSThe set of geometrical properties obtained from the inertia moment method may have significant factors and insignificant factors as well, due to the variability of forms in the set of specimens used. The significant factors, which are still unknown, may differ according to the materials that are used. Even if the significant factors have been estimated, their behavior may also be different, according to the materials used. Therefore, the significant factors must be extracted from the set of geometrical properties in each case that is studied. There are various methods for extracting the significant factors. Most of them are statistical multivariate analyses. Accordingly, the significant factors must be extracted from the sets of geometrical properties obtained from the specimens used in the present study as the first step. This treatment was carried out by applying principal component analysis to all of the specimens measured. Four principal components, having markedly high magnitude in their eigenvalues, were found in this analysis, as seen in Table 17. 1. The other eigenvalues were discretely lower.
The principal component I has a very high eigenvalue and shows intensive correlations (component loadings) with the properties theoretically related to size; whereas it has faint correlations with the properties theoretically independent of size (Dx, Dy). This com ponent has an almost full correlation to the area A, which, on the other hand, has almost no correlations with the other components. Therefore, the principal component I can be regarded as the pure size component, and the size can be represented only by the area A. The pair of L and B, as well as that of Rx and Ry, have markedly high correlations with the principal component II. Moreover, these pairs of properties have the same behavior, i.e. L and Rx have a positive correlation whereas B and Ry have a negative correlation. Judging from this behavior, the principal component II represents the slenderness of the form. The principal components III and IV are related only to Dx and Dy, showing relatively high correlations with them. Dx and Dy are theoretically related to the asymmetries around the transverse axis and the longitudinal axis, respectively. Therefore, these principal components are related to the asymmetry of the form. 17. 7 CHARACTERS REPRESENTING FORMFrom the principal component analysis, it can be concluded that the two-dimensional form of the unretouched flakes from the deposit columns in the Douara Cave used in the present study are principally represented by four factors, i.e. size, slenderness, longitudinal asymmetry, and transverse asymmetry. The latter three factors express the pure shape. The size can be represented by the area A, as described above. The extremely high correlation with the principal component of the size indicates that the area A is almost the size itself. As for the shape, the original properties theoretically can be transformed into three nondimensional characters representing the above three factors of the pure shape, which are completely independent of the size, because of their nondimensional nature. They are as follows:
where Ex1=L/2+Dx,Ex2=L-Ex1,Ey1=B/2+Dy and Ey2=B-Ey1(cf. Fig. 17. 9).
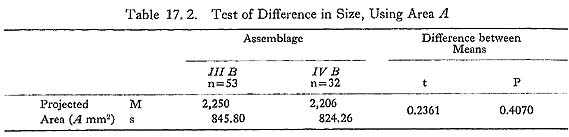
The above three indices represent the whole significant shape of the unretouched flakes used in the present study. The whole significant shape means, in other words, the principal shape. Four characters consisting of these three shape characters and the character of the area A can represent the whole significant form or the principal form of the unretouched flakes used in the present study. It should be noted that it seems better to use the principal components directly for further analysis. However, concrete meanings are lost when they are used, even though each geometrical property has a clear meaning. The principal component itself only implies its meaning. This is the reason why the above-described indices are used in the present study. The concrete physical meanings are retained in the present study, therefore, and they are useful in the interpretation of the difference or similarity between the forms of stone artifacts, which will be described later. 17. 8 DIFFERENCE IN SIZEThe difference in size between the unretouched flakes from assemblage III B and those of assemblage IV B can be examined by the t-test of two means of area A of these as semblages. The results are shown in Table 17. 2. The high probability P of 0.4070 means that there is no difference at all in size between the two flake assemblages.
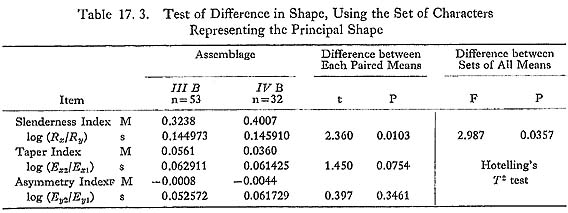
17. 9 DIFFERENCE IN SHAPEThe difference in the principal shape between the unretouched flake assemblages of III B and of IV B can be examined by Hotelling's T2 test of multivariates, using the three shape characters described above. The results shown in Table 17. 3 indicate that there is a difference in the principal shape at a level of significance of 0.05, for the probability is only 0.0357, which is lower than this level.
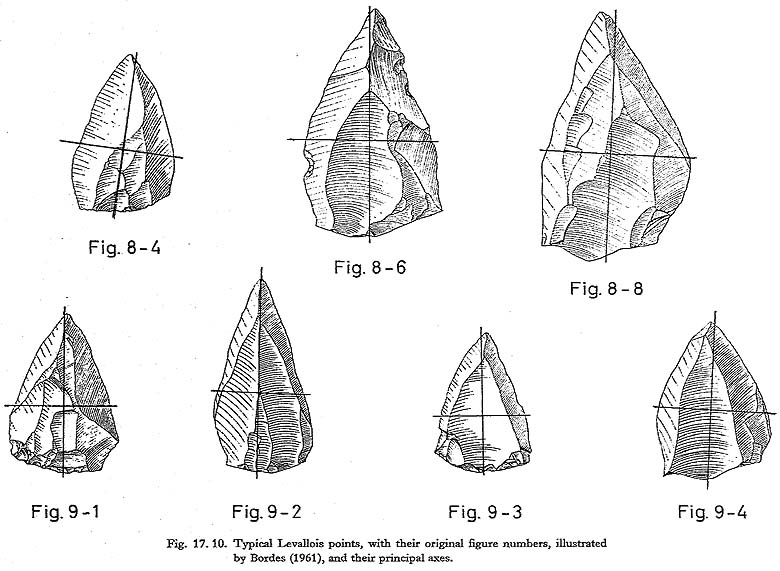
When each paired means from assemblage III B and assemblage IV B is examined by the t-test, a significant difference in slenderness is detected. The flakes from assemblage IV B are generally slenderer than those from assemblage III B. This means either that the flakes from IV B tend to be more blade-like in shape or that the frequency of the blades is higher. In addition, there is a faint difference in taper seen from the probability of 0.075, though it is not statistically significant if the level is set at 0.05. It seems, however, that this fact has influence upon the difference in principal shape. Either the flakes from III B may be slightly more tapered in general or the triangular points are slightly more abundant in the assemblage III B. No difference can be found in the side asymmetry between the samples of flakes from these assemblages. 17. 10 NUMERICAL TYPOLOGYUsually, the complete Middle Paleolithic flakes are divided into three principal types: flake, blade, and point. The typological division into flake and blade has been made by using the ratio of 2: 1 of the length and breadth by means of the traditional linear meas urement. This division and the analysis based on it have already been carried out by Akazawa (1979). Because the length and the breadth of the linear measurement method and those of the inertia moment method are different in determining the axis of the flake, the present report is not concerned with this problem. Judging whether an artifact is of the point type or not is very difficult when the tradi tional measurement is used and the division is done metrically. Linear measurement hardly seems applicable. However, the inertia moment measurement method can identify the type of point by using the characters representing the principal shape, which have been de scribed above. The set of three indices representing the pure and principal shape is now used for numerical identification of the typical Levallois point type. For this identification, the test of rejection of multidimensional vectors developed by Masuyama (1943; see also Note 1) is employed. As for the standard sample, seven typical Levallois points defined and demonstrated by Bordes (1961) are used in the present study. They are all shown in Fig. 17. 10, with the principal axes determined by the inertia moment method in the pres ent study. F values of the test are computed, based on this set.
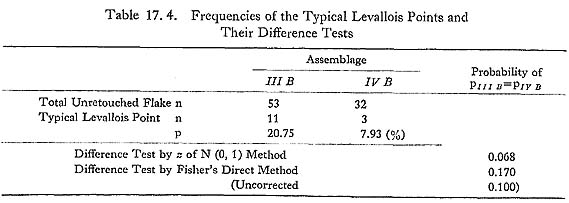
The results thus obtained are shown in Table 17. 4, It seems at a glance that the fre quency of appearance of the typical Levallois point in assemblage III B is higher than the same frequency in assemblage IV B. However, the difference tests of the usual method based on z of the standard normal distribution and of the method directly computing the probability, as developed by Fisher (see Note 2), show that the probability is higher than the level of significance of 0.05. Consequently, there is no statistical difference be tween the frequencies of typical Levallois points from the two assemblages. The discrep ancy in probability between these methods may be due to the smallness in number of typical points in assemblage IV B. The probability obtained from Fisher's method is more correct.
17.11 SUMMARYThe difference in form between the complete unretouched flakes from assemblage III B and those from assemblage IV B in the Middle Paleolithic deposits of the Douara Cave site has been metrically and numerically analyzed by means of the inertia moment method developed by the present author and by means of statistical multivariate analyses. Most of the stone artifacts uncovered in this cave are unretouched flakes.
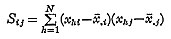
NOTESNote 1Let a standard sample be X1, X2, … , Xh, XN, where Then calculate
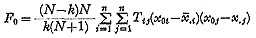
and [Sij]-1[Tij]. Let the specimen for the test be X0. Then F0 for the F test is obtained as:
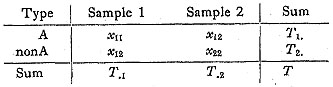
where n1=k and n2=N-k (from Masuyama, 1975). Note2Let the number of Type A be xi1 and the number of Type nonA be xi2, found in a sample having its number T.1, where i=1 or 2. Then the following table can be formed:
The probability of the identity of both the frequencies of Type A is as follows:
where x12=k, in the case x11x22-x12x21>0 and xij≥0. And
in the case x11x12-x12x21≥0. LITERATURE CITED
|


 ,
, ) is obtained as: