ECOLOGY OF RECENT OSTRACODS IN THE HAMANA-KO REGION, THE PACIFIC COAST OF JAPAN
Noriyuki Ikeya* and Tetsuro Hanai**
*Institute of Geoscience, Faculty of Science, Shizuoka University
**Geological Institute, Faculty of Science, The University of Tokyo
Ecological analysis of ostracod fauna
|
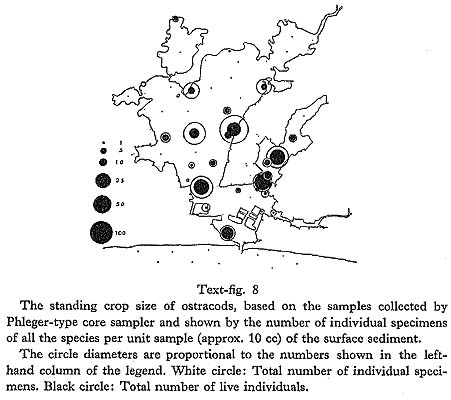
Standing crop size of ostracods: Among 50 samples collected by a Phleger-type core sampler for quantitative analysis, 27 samples contained ostracod specimens. From these samples, the number of individuals per unit sample (ca. 10 cc) of the surface sediment is calculated to give the density distribution of ostracods. The total number of individuals per unit sample ranges from 1 to 151, and the maximum number of living specimens per unit sample is 46. Thus, it can be said that at maximum 4 to 5 living ostracods inhabit 1 cm2. The densities of the total number of specimens as well as the ratio between living and dead specimens vary from station to station. A relatively high density of the total number of ostracods is found in the patches of moderately coarse sediments near the channels, where the living specimens are also found in high density making up 16 to 63% of the total number of specimens, and suggest a high productivity of ostracods in these areas. The ostracod density is low in the northern brackish water area and high in the southern marine water area. Low density is also observed in the sand bank of the southern area. It is interesting to note that these results are contrary to those of foraminifers, i.e., the density of benthonic foraminifers is high in the northern half of the bay, because of the abundant occurrence of those with agglutinated tests (Ikeya, 1977). The standing crop size of ostracods is shown in text-figure 8.
Species diversity of ostracods: Among the seventy species of ostracods belonging to 45 genera which were identified in this paper, 44 species belonging to 31 genera were found alive. The number of total and living individuals from each station are tabulated for each taxon in tables 2 through 5 with the data of the volume of sediments used. The total number of species per station ranges from 42 to 1, and the number of living species per station ranges from 13 to 0. The total number of species is largest in the area adjacent to and on both sides of the mouth of the bay, where the interaction of coastal and bay waters is detectable from hydrographic data. The number of total and living species is moderately large at the stations along the shore of Enshu-nada, where the coastal current is strong, and along the channel of the bay, where the influence of marine water is reduced. The smallest number of species is found in the brackish water area, especially in the inner most part of the bay, where the ostracod fauna is simple and composed of only a few species. Numerical distribution of the living species per total species is given in text-figure 9. Among the species whose empty carapaces are found commonly in the area along the coast of Enshu-nada, the following have never been found alive, suggesting that they are allochthonous being transferred from adjacent areas by coastal current: Cytherel-loidea munechikai, Callistocythere sp., Paijenborchella triangularis, Proteoconcha tomokoae, Trachyleberis? tosaensis, and Loxoconcha (L.) optima.
Yule-Simpson's diversity index based on the number of species and the number of individuals in each species (Yule, 1944; Simpson, 1949) is adopted to analyze the correlation between ostracod biomass and the environments. Calculations of the numerical diversity values are based on the total number of specimens, because living specimens are too few to obtain values within the limits of confidence reasonable for discussion. For the same reason, when the total number of specimens is less than 10 individuals, the values are eliminated from the distribution map. For further explanation of this index, see Ikeya (1971, p. 186). Area distribution of the diversity indices is shown in text-figure 10. The distribution pattern of the diversity indices agrees on the whole with the distribution pattern of biofacies. In the inner bay area under brackish water conditions, the diversity values are less than 2, and the value increases toward the mouth of the bay. Patchy distribution of high indices in the inner area of the bay is regarded as the result of the inflow of ostracods from the fresh water ponds. Fluctuations of the indices in the Enshu-nada area, together with the occurrence of allochthonous ostracods, may suggest the strong sieving effect of the wave base and the coastal current on the accumulation of dead ostracod carapaces. The highest index value of 18.4 is found at station 54 on the Enshunada Coast.
|