4. TOOTH CROWN MEASUREMENTS
4.1. Comparison of Individual Teeth between Populations
4.1.1. Deciduous DentitionIn the first place, the mesiodistal crown diameters in the deciduous dentition were directly compared between Aborigines and other four populations studied by the present author. It is quite obvious that all the deciduous teeth in Aborigines, both males and females, show the largest mesiodistal crown diameters among the five populations involved (Tables 3 and 4). However, the standard deviations in Aborigines are not significantly different from those of the remaining populations.
As to comparison between the present study and the data for the Aborigines which were reported by Campbell (1925) and Barrett et al. (1963), the former shows the largest values in the six deciduous teeth, and the latter provides the largest values in the remaining four deciduous teeth. Although the differences between each other are rather small, such discrepancies might have been caused by several reasons such as difference in areas from. which the materials were obtained, difference in number of materials measured, slight difference in measuring technique between investigators, etc. However, even if the smallest values in Aborigines are taken into account, they still show the largest mean mesiodistal crown diameters among several populations including those studied by the present author and previous authors (Table 5). This finding evidently shows that Aborigines are one of the groups which carry the largest deciduous dentition among modern human populations.
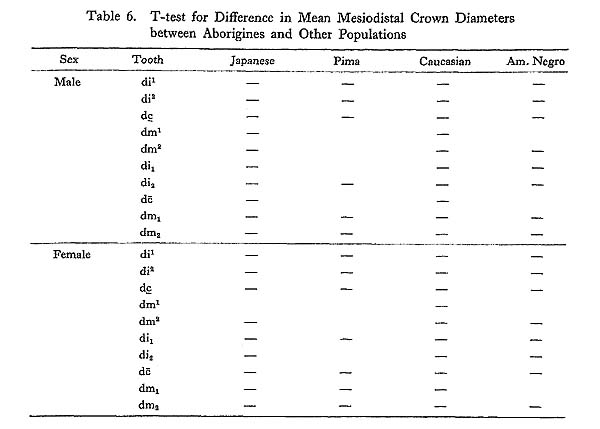
To discuss the differences between Aborigines and the other populations in more detail, a t-test for significance of difference between means was carried out. In Table 6, minus signs show that the teeth in respective populations are significantly smaller than those of Aborigines at the 5% level.
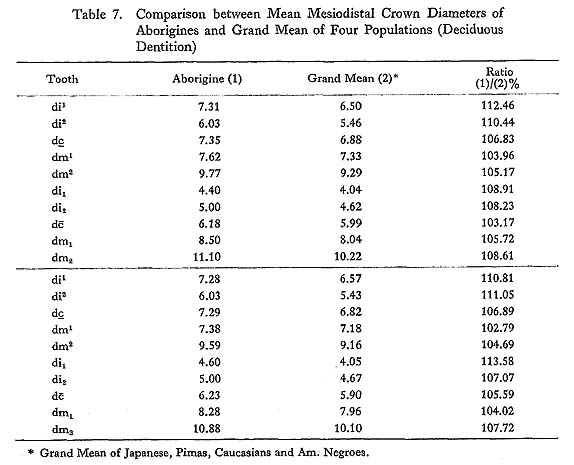
As a whole. Aborigines exceed other populations in most of the mesiodistal crown diameters. There are, however, some teeth which show no significant difference from those of Aborigines. In particular, Pimas seem to carry the maxillary deciduous molars which are almost comparable with those of Aborigines in size. Almost the same trend, though to somewhat less extent, is also recognized in American Negroes in which four teeth show no significant difference from those of Aborigines. On the other hand, Japanese and American Caucasians carry much smaller teeth than Aborigines, with the only exception of the maxillary first deciduous molar in Japanese. In order to recognize the general trend of difference in each tooth, the ratio between mean values of Aborigines and grand means of other four populations were calculated. As can be seen in Table 7, differences in mesiodistal crown diameters are larger in the deciduous incisors and smaller in the deciduous molars. This trend is almost the same in either males or females, and in maxillary or mandiblular dentitions.
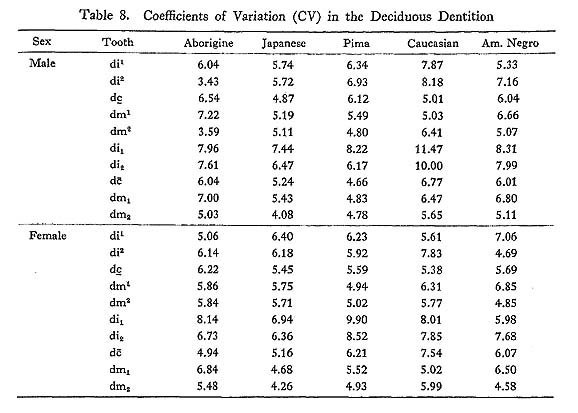
Barrett et al. (1963) stated that the most striking difference in tooth size between Aborigines and other groups had been shown by the mandibular deciduous second molars. However, if the same ratios as above are calculated from the data given by them, the deciduous incisors show still the largest difference between Aborigines and other populations. The present author will return to this point later. The difference between sexes in the Aborigines is not so large. In fact, the significant differences are shown only by the maxillary and mandibular deciduous molars, and this trend is almost the same in the other modern human populations. Sex difference in overall size of the teeth will be discussed later. Barrett et al. (1963) discussed variability in mesiodistal crown diameters of each tooth. Based on the coefficients of variation (100 × s.d./mean), they found that the variability was greater in male subjects than in females with a minor exception. However, if the same coefficients are calculated from the data obtained by the present author, there seem to be no general trend in sex difference of the variability (Table 8).
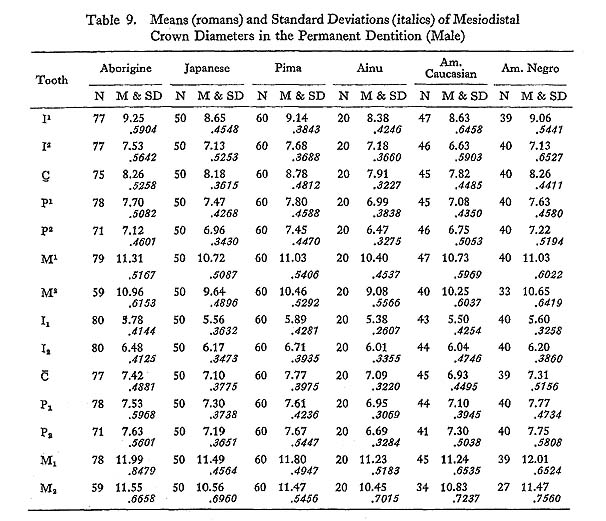
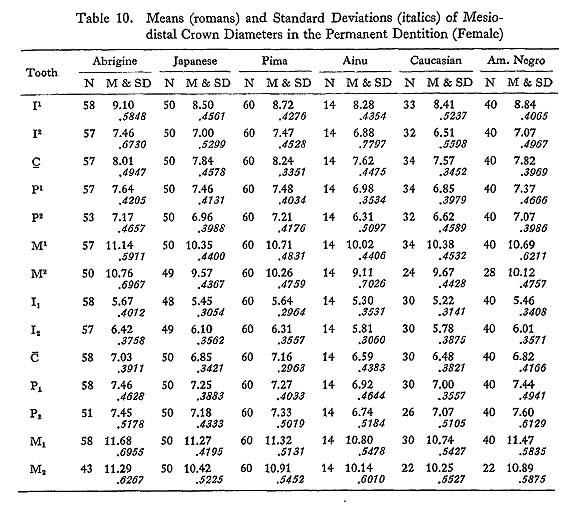
For instance, five teeth show greater variability in females than in males of Aborigines, six teeth of Japanese and Pimas, four teeth of Caucasians, and three teeth of American Negroes. In addition, the teeth which show greater variability in males than in females are randomly distributed in the dentition. This seems to show that the difference in variability between sexes shows no general trend among modern human populations. On the other hand, difference in variability among the modern populations is also hardly detectable from the data shown in Table 8. 4.1.2. Permanent DentitionIn the present study, mesiodistal crown diameters in the permanent dentition of Aborigines were compared with those of Japanese, Pimas, Ainu, American Caucasians and American Negroes, all of which were measured by the present author (Tables 9 and 10).
As a whole, Aborigines exceed most of the other populations in crown size and this fact is comparable with the deciduous dentition. However, Aborigines are rather smaller than Pimas in some teeth. In males, nine teeth out of fourteen show larger mean values in Pimas than in Aborigines. The most striking difference is recognized in the maxillary canines, in which the mean mesiodistal crown diameter in Pimas amounts to 106.3% of that in Aborigines. Also in the mandibular canines, Pimas show 104.7% of Aborigines. On the contrary, the maxillary lower molars of Aborigines are larger than those of Pimas. Almost the same trend is recognized when the tooth sizes for Pimas are compared with those of Aborigines reported by Campbell (1925) and Barrett et al. (1963) (Table 11). In Campbell's data, Aborigines are smaller than Pimas in six teeth out of fourteen, and ten teeth out of fourteen in the data provided by Barrett et al. At the same time, very similar difference can be seen in the data for females. These results likely suggest the predominance in size of particular teeth of Pimas over those of Aborigines.
As in the deciduous dentition, a t-test of difference of means between Aborigines and other populations was applied. In Table 12, minus signs show significantly smaller teeth and plus signs significantly larger teeth compared with those of Aborigines at the 5% level.
As described above, Japanese, Ainu and Caucasians show smaller values than Aborigines in most of the teeth. Pimas show larger values in the canines and some other front teeth, but almost the same or a little bit smaller values in the premolars and molars. On the other hand, American Negroes show smaller values than Aborigines in some teeth, but almost the same values in others. It is quite interesting to note that overall size of the crowns in the deciduous dentition is the largest in Aborigines and followed by Pimas, but in the permanent dentition, Pimas exceed Aborigines in size of some teeth, and the latter is not necessarily the largest population in the tooth crown size among modern human populations. The mean values for Aborigines are always larger than those of populations reported by previous authors. The only exception may be seen in the lower molars between Aborigines reported by Barrett et al. (1963) and Aleut by Moorrees (1957). However, the mean value given by Barrett et al. seems to be too small compared with values given by Campbell (1925) and the present author. In order to learn the general trend of the crown size in Aborigines, as in the deciduous dentition, ratios between mean mesiodistal crown diameters of Aborigines and grand means of those of Japanese, Pimas, Ainu, Caucasians and American Negroes were calculated (Table 13). In general, the ratios show small deviations from tooth to tooth, but relatively small in the canines and particularly large in the maxillary second molars, both males and females. This trend seems to show that the canines might be relatively stable in size, and on the contrary, the maxillary molars might be more variable among modern human populations. In other words, the maxillary molars in Aborigines seem to be less reduced in comparison with those of the other populations. On the other hand, the mandibular second molars show somewhat smaller ratios than the maxillary second molars, showing a little more stability of the former than the latter.
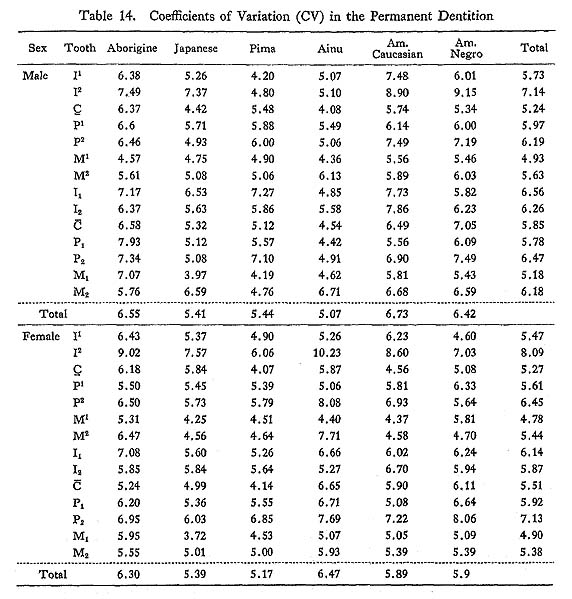
Sex difference in tooth crown size is relatively small in Aborigines. A student's t-test shows that a statistically significant difference exists only in the mandibular canines under the 1% level. This is quite comparable with most of the other populations compared. On the other hand, Barrett et al. (1963) found significant sex differences in all the teeth except for the third molars and the mandibular first premolars, and the most pronounced differences were found in the mandibular canines and the first molars. Although the same trend was recognized by the present author, there seem to be a minor discrepancy between the results of statistical tests carried out in the two investigations. It is rather doubtful, however, that Aborigines show much larger sex differences in comparison with the other populations, because the statistical significance does not necessarily represent the amount of difference which was tested. Further discussions on sex difference in tooth crown size will appear later. Barrett et al. (1963) pointed out that, according to coefficients of variation, the third molars and the maxillary lateral incisors varied most in size and the first molars least. In the male samples of the present study, however, the mandibular first molar shows relatively large size variability (Table 14). The mesiodistal crown diameters of this tooth range from 10.50mm to 13.60mm which are almost comparable with those reported by Barrett et al. On the other hand, the female samples of the present study show very similar coefficients of variation to those reported by Barrett et al., but still the coefficient for the mandibular first molars is somewhat larger than that for the mandibular second molars.
Compared with the other five populations listed in Table 15, Aborigines show relatively large size variability, both in males and females; and Caucasians and American Negroes also show larger coefficients than the Mongoloid populations. This result probably tells that the coefficients of variation do not reflect the size of teeth in respective populations.
It is of interest to observe mean values of coefficients of variation in the populations presented here. As stated by Barrett et al., the coefficients for the maxillary lateral incisors are the largest and those for the first molars the smallest, being particularly small in the maxillary first molars. Next to the first molars, the maxillary and mandibular canines also show relatively small size variability. Within each morphological tooth group, the distal teeth usually show greater variability than the mesial teeth to a more or less extent. The only exception is the mandibular incisors in which the lateral teeth show considerably smaller size variability in com parison with the mesial teeth. Several authors such as Butler (1939), Dahlberg (1945, 49) and Moorrees (1957) have drawn attention to the fact that in general tooth size and morphology are more stable in the mesial teeth than in the distal teeth within each tooth group, but here again the reverse is true for the mandibular incisor group. In addition, the canines seem to be relatively stable in comparison with the teeth which belong to the other tooth groups. The general trend shown by coefficients of variation is quite compatible with observations pointed out by previous authors. 4.1.3. Depth of Lingual Fossa in the Permanent Maxillary Central IncisorsSince However, the expression of the shovel-shaping is continuously distributed and hence it might be rather inappropriate to apply the analytical methods for discrete traits to this character. Based on this view, Dahlberg and Mikkelsen (1949) made direct measure ments of the shovel-shaped character. They applied this method to the incisors of Pima Indians using a modified Bowley gauge. The same method was also employed by Carbonell (1963) but she attached importance rather to the ordinary method in her discussions. Because of morphological delicacy, however, the measuring instruments should be carefully designed to measure depth of the lingual fossa in the incisors. In 1970, Hani hara et al. developed a more reliable instrument that allows fairly detailed measurements. This is a dial gauge with a pair of adjustable arms which is accurate to 0.01 mm and reads to the nearest 0.05 mm. Using this dial gauge, they measured depth of the lingual fossa of the maxillary central incisors and found that 1) this character represented a typical normal distribu tion so that the ordinary statistical procedures could be applied without any trans formation of the original data; 2) there was a high correlation between the measure ments and the categories of classification which had been used by previous authors; and 3) there was no significant sex difference in mean values of this measurement. Based on such findings, they compared average values among Japanese, American Caucasians, Pima Indians and American Negroes, and found considerable differences which paralleled the results obtained by the usual method of classification. Following this method, the present author measured depth of the lingual fossa of the maxillary central incisors in Aborigines as a measure of the shovel-shaping, and compared with those of several other populations. It is quite evident from Table 15 that Pimas represent the largest mean values and are followed by Japanese and Ainu. On the other hand, Caucasians show the smallest mean value among the six populations compared and American Negroes are the next smallest. These results are almost com pletely compatible with those obtained through traditional observation method of the shovel-shaped character. Among the five populations, Aborigines represent an intermediate mean value be tween the Mongoloids and the Caucasians as well as the American Negroes. On the other hand, difference between Aborigines and Ainu is small and statistically insignificant, so that the two populations are quite similar to each other as far as this particular trait is concerned. The mean value of this trait in American Negroes is close to that of Caucasians, but probably it has been affected by admixture with Caucasians to some extent. According to Carbonell (1963), frequencies of shovel-shaped maxillary central incisors are 21.1% in Anglo-Saxons, 34.3% in Bantu and 92.7% in Asian Mongoloids. These data seem to suggest that the shovel-shaping in Negroes might be much closer to Caucasians than to Mongoloids, even if full-blood Negroes were observed. |


 (1920) has drawn attention to the anthropological importance of the shovel-shaped teeth, a number of studies of this character have been carried out in regard to between-population differences, genetics, evolutionary significance, morpho genesis, etc. Most of these works employed non-metrical method of classification, so that the expression of the shovel-shaping was usually classified into a few discrete categories and analysed in the same manner as blood groups, ear wax pattern, and so forth.